Amazon teams with Esri, HERE to offer location-based data, mapping services

Amazon’s cloud platform Amazon Web Services (AWS) has launched a new service that would give developers access to maps and location-based services from multiple geospatial data providers on an economical, pay-as-you-go basis. Currently available as a public preview, Amazon Location Service is priced at a fraction of common alternatives such as the Google Maps Platform.
Must read: Insane, shocking, outrageous: Developers react to changes in Google Maps API
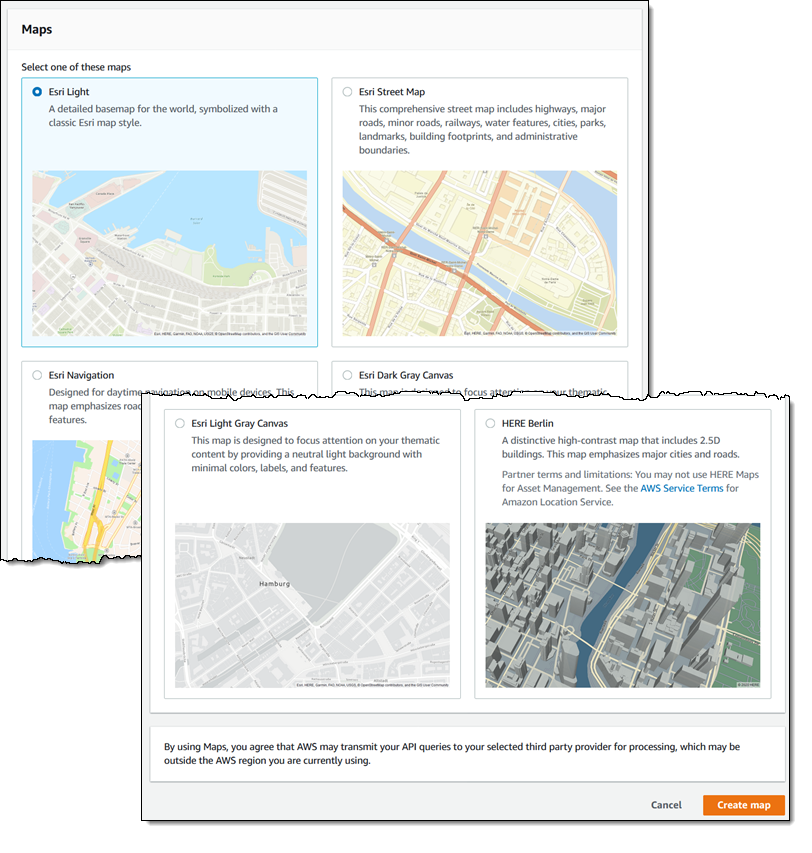
Developers can use Amazon Location Service to build web and mobile apps that know where they are and respond accordingly. “You can display maps, validate addresses, perform geocoding (turn an address into a location), track the movement of packages and devices, and much more. You can easily set up geofences and receive notifications when tracked items enter or leave a geofenced area. You can even overlay your own data on the map while retaining full control,” explains Jeff Barr, Chief Evangelist for AWS.
Amazon Location Services provides high-quality geospatial data from global tech giants Esri and HERE. The platform anonymizes all the queries sent to these data providers by removing customer metadata and account information. It also shields sensitive tracking and geofencing location information, such as facility, asset, and personnel locations.
This means user privacy is protected and the application’s security risks are also reduced. This also means that neither Amazon nor third parties have any rights to sell the user data or use it for advertising.
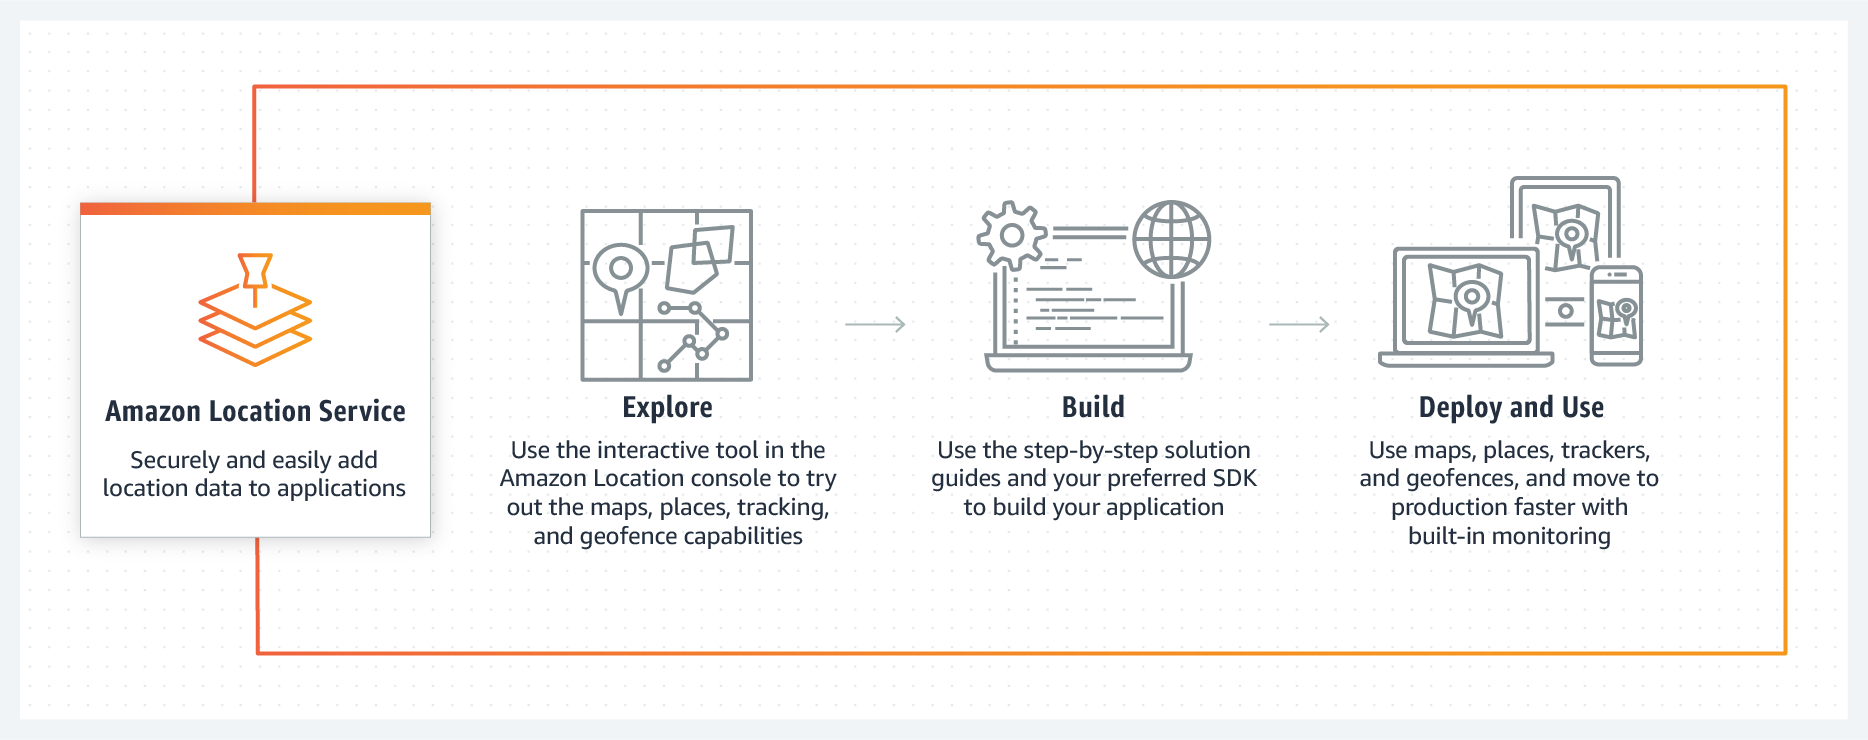
Here’s how the service works:
AWS made Amazon Location available to MobileLog – a service that helps businesses track and trace their deliveries and vehicles in real-time – for evaluation before announcing its preview launch. Its CEO and Co-founder, Dejan Milosavljevic, shared this feedback:
“When we evaluated Amazon Location Service, we realized we can get the tracking capabilities we need, and also consolidate location-related infrastructure we were hosting on Google. We’re also reducing the number of microservices that we have to maintain because Amazon Location already provides them. The simplification that Amazon Location enables is a huge benefit to us, and I expect it will help us cut overall costs and speed up our development cycles.”
It’s worth observing that after Google Maps Platform announced an exorbitant price hike for its Maps API in 2018, developers have been exceedingly looking for alternatives. And while Amazon Location’s current feature set does not fill all the gaps in the market, it’s fair to assume that AWS will continue to add more capabilities and position itself to take a large piece of the pie.
Amazon Location Service Pricing
In the Preview period, Amazon Location Service will be free of cost. But there are three pricing plans available – all of which require no up-front commitment or minimum fee. You are only charged for what you use. These pricing plans are:
Request-Based Usage: This plan is suited for apps that provide maps and other location information to external users such as customers, or internal applications that don’t involve tracking or routing of assets. Businesses are billed for each request the app makes to the service.
You can evaluate Amazon Location Service at no cost during your first three months of Request-Based Usage. After the free-tier period is over, expect to pay the following prices:
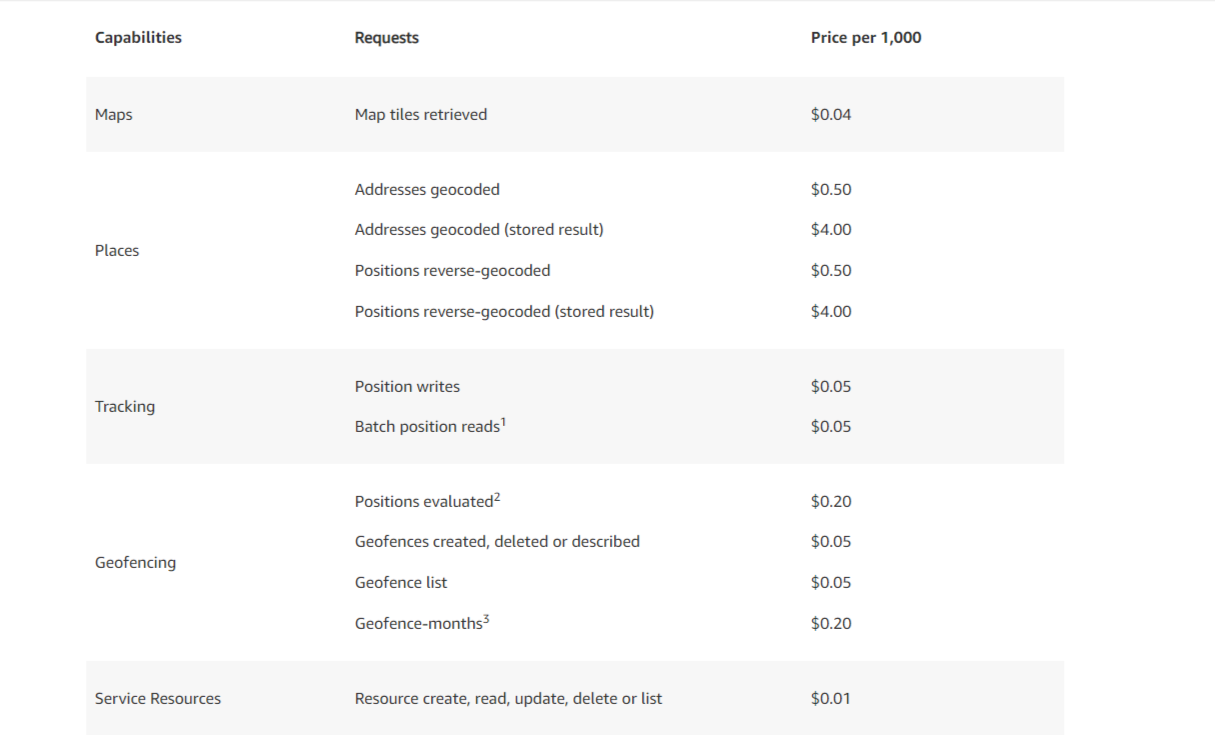
Courtesy: AWS
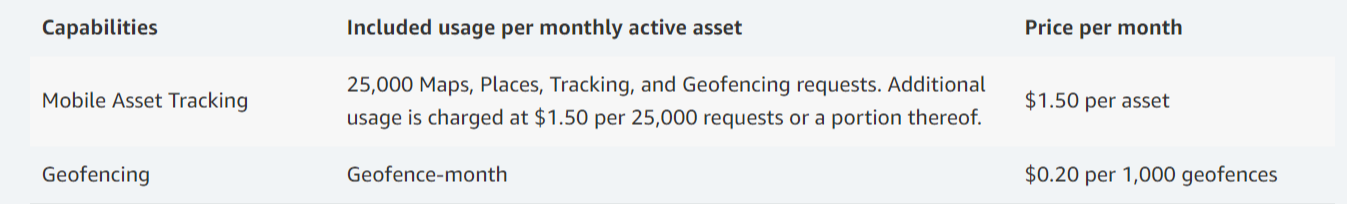
Mobile Asset Tracking: Optimized for apps that use Amazon Location Service Maps or Places for tracking of mobile assets, this plan will cost you a fixed monthly fee per asset, with 25,000 location data requests per asset included. Note that routing or route optimization services are not included in this plan. Here’s how this plan is priced:
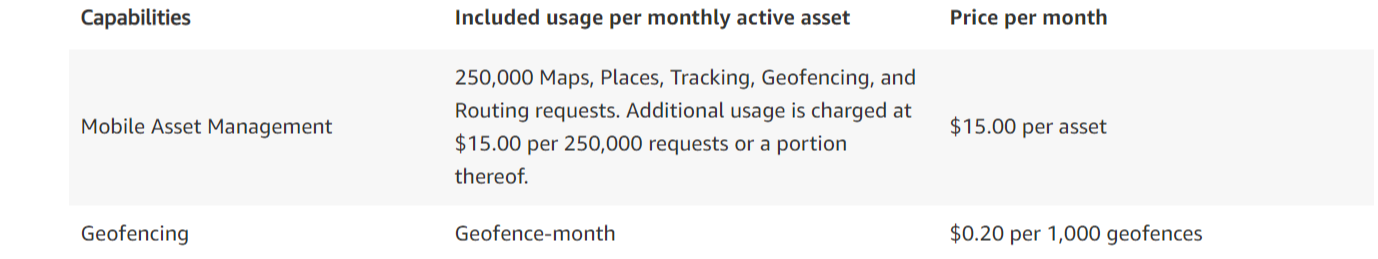
Mobile Asset Management: This plan is meant for those applications that use Amazon Location Service Maps or Places for tracking, as well as routing or route optimization of mobile assets. Here also you can expect a predictable, fixed monthly price per asset, with 250,000 location data requests per asset included. This is how the pricing looks like for this plan:
Do note that all the above prices are for the US East (N. Virginia) AWS Region. Pricing for the other regions will be provided when the service is made generally available.
How to get started
You can access Amazon Location Service from the AWS Management Console, AWS Command Line Interface (CLI), or via a set of APIs. You can also use existing map libraries such as Mapbox GL and Tangram.
For more information on Amazon Location Service and a deep dive into how to use its different resources for your applications, we recommend you read Jeff’s blog here.

#Business


Next article

There are many ways to draw driving-time polygons on a map: desktop, web or cloud-based platforms all enable the creation of isochrone maps using APIs. For this article, we only focus on GIS-based tools that use different APIs to create isochrone maps and compare them with each other.
Today, many mapping solution providers offer isochrone mapping services. Here, we only focus on GIS-based isochrone mapping tools that use API calls for input data to create driving time isochrones. This means we do not use cloud-based or web-based mapping tools, but only cover desktop mapping software where the driving-time isochrone maps can be created and visualized.
The tools chosen here are the TravelTime plugin for QGIS, the Generate Service Area tool in ArcGIS Pro and the Hqgis plugin for QGIS. Also, it should be noted that the tools described here offer more functionality than just creating isochrones, such as geocoding and routing. Additional functionalities are not covered here, the sole focus here lies on creating driving-time isochrones.
After giving a short introduction of each provider’s service, we’ll provide the following information:
- how driving time data is collected and used
- how travel time polygons are drawn
- how long it takes to draw the polygons
- what are the available transportation modes for each solution
- How much is charged for using the API
What are travel time polygons?
Travel time polygons or isochrones show the area that is reachable from a starting point in a given amount of time, for a certain method of transport. Polygons are 2D shapes consisting of five or more vertices. The three providers covered here all offer travel time polygon drawing services in a GIS environment. We’ll now have a look at some travel time isochrones and different product features for each solution provider.
TravelTime
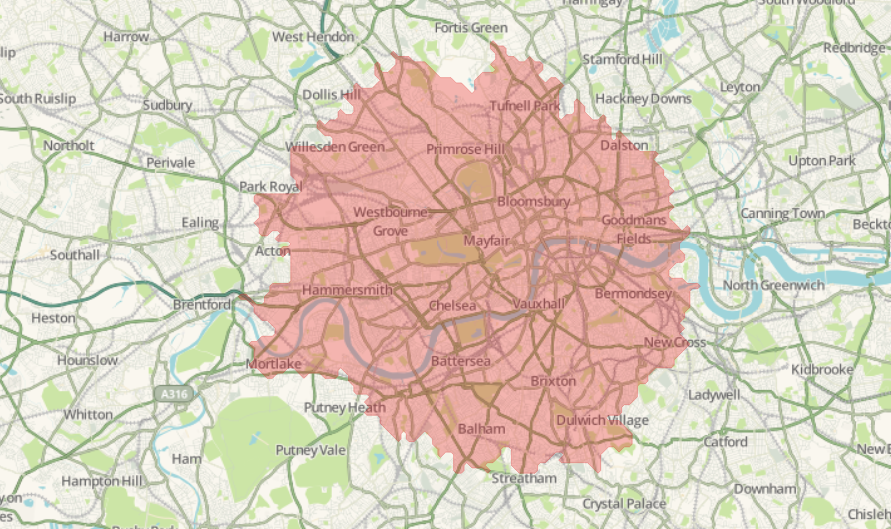
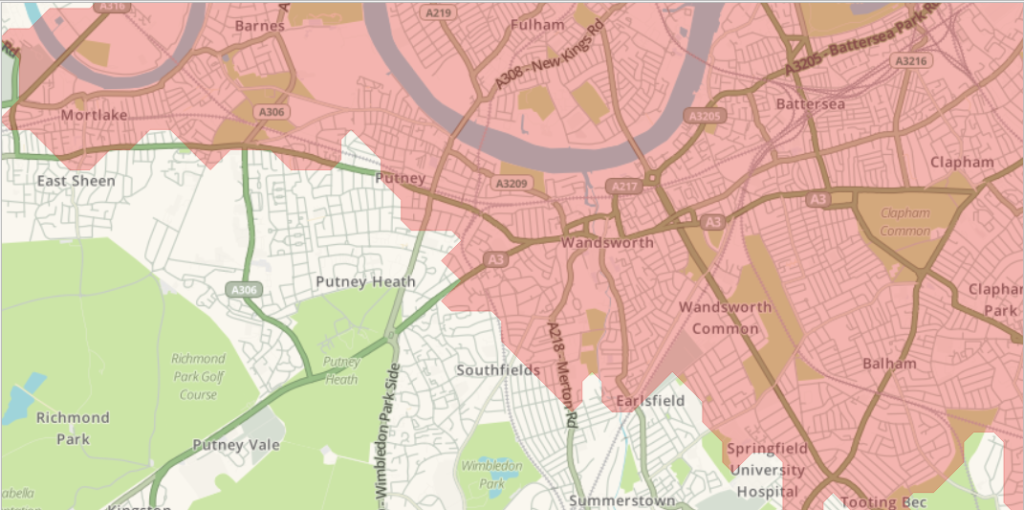
TravelTime makes locations searchable by travel time. They offer analytics integrations with QGIS, ArcGIS and Alteryx, as well as location site search for e-commerce, website and apps via an API. Here’s an example of a 45-minute driving time map of London, created with the TravelTime plugin for QGIS:
Driving models
TravelTime has built its own proprietary model for predicting and calculating drive times.
This is built around peak and off-peak hours, rather than real-time traffic data, in order to provide reliable, consistent results. The model itself takes a range of data sets such as OpenStreetMap and country-specific data, and then constructs speed profiles based around road types, the surrounding area, and features of the road itself. These speed profiles are then benchmarked on test maps, fine-tuned, and then set live. Once live, the models are regularly re-tested and updated.
How the polygons are drawn
Isochrones can be created by clicking the Quick Time Map query on the TravelTime platform menu, the third icon from the left on the image below:
![]()
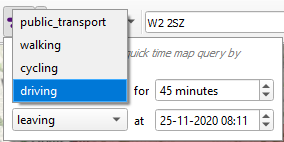
The tool has four parameters: you are required to enter a date/time, mode of transport, time limit for the isochrone and whether you are leading or arriving:
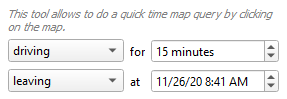
By taking into account the amount of traffic for that moment when creating the resulting travel time polygon, the results are more realistic and reliable. Next, you can click on the map to start creating the isochrone from any location. The advanced isochrone functionality, discussed below, works the same way but can use point layers as departure/arrival locations.
The resulting polygon, displayed at the beginning of this section, shows a polygon with multiple vertices. Using the toolbox, we can create a better result as there are more tool parameters, such as more transportation types aggregation of the results (available are Normal, Union and Intersection). Here’s an overview of all tool parameters:
A detailed image shows the many vertices in the resulting driving time polygon:
Isochrone performance
Using the Quick Time Map query tool, the results are generated instantly and added to the map. The algorithm works fast and returns many isochrones at once for entire point layers within seconds.
Available transport modes
As displayed below, the Quick Time Map query tool offers four transportation modes, public transport, walking, cycling and driving:
More options are available by clicking the “Show the toolbox” button on the menu on the far left (selected):

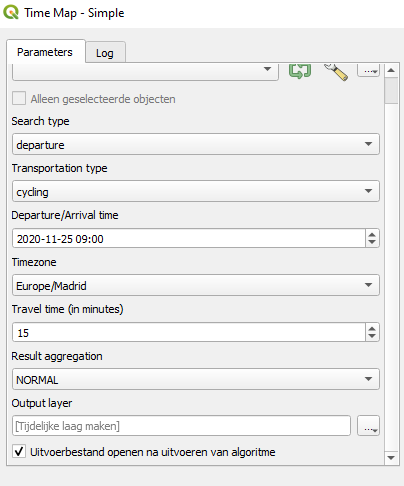
Clicking this button will open up the following toolbox on the right of the screen:
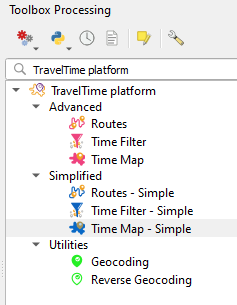
Selecting “Time Map – Simple” under “Simplified”, we can now select more transportation modes:
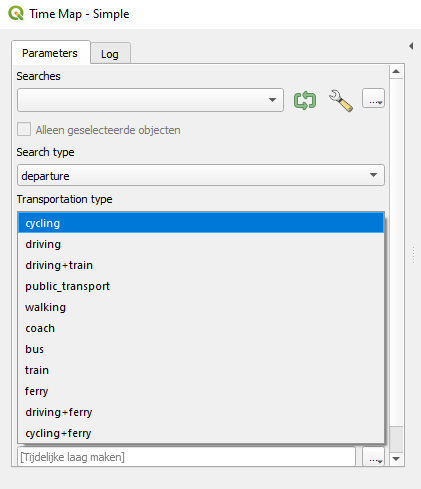
We can see that apart from walking, cycling, driving, public transport, the tool offers multimodal transport as well, combining different transportation modes.
Pricing
TravelTime’s licensing differs per use case. There are multiple options for using the TravelTime API for adding polygons on a customer-facing website, app or software: Standard (£600 / month) enables 100k searches / month, where a single search equals making a single isochrone with 1 departure or arrival time & 1 transport mode. Standard Plus (£1000 / month) enables 200K searches / month. API pricing for an internal business app is £250 / month. The same amount is charged for an API key for Esri, QGIS, Alteryx and API/SDK integrations.
Want to try for yourself? Sign up for a TravelTime API key here. Creating isochrone maps in QGIS is similar in ArcGIS using the TravelTime add-in for ArcGIS.
Esri
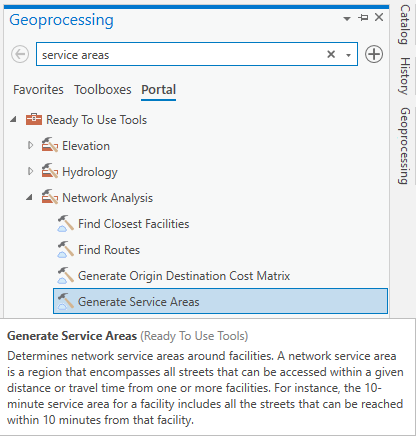
Esri offers the creation of service areas based on driving time through the >Generate Service Areas tool, which can be accessed in ArcGIS Pro. This tool uses the ArcGIS REST API for creating driving time isochrones and is accessible through the Ready To Use Tools under Network Analysis tools, and requires a Portal Extension and ArcGIS Online organizational account. When running the tool, Esri credits are consumed. Here’s an image that shows where to find the tool:
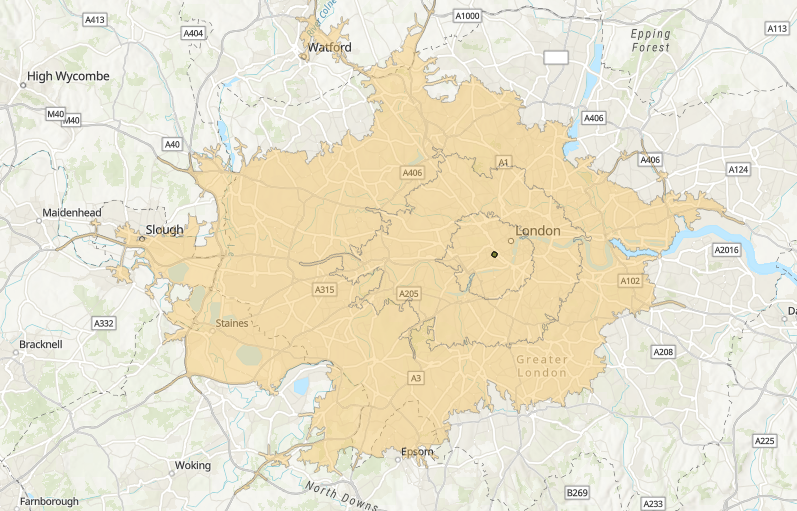
This is the result for 15/30/45 minute driving time isochrones for a point location in Central London:
Driving models
The online tool documentation states that the tool determines network service areas around facilities. The tool creates drive-time areas if the value for the Break Units parameter is set to a time unit, or drive-distance areas if the Break Units are distance units. Travel time data is based on information from data and services providers such as HERE.
How the polygons are drawn
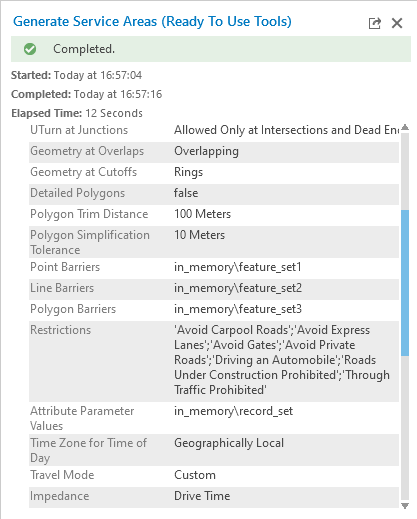
This tool has a lot of parameters that can be set to create driving time polygons. The image below only shows a few of them, but the tool takes into account many details not present in similar tools from other providers, such as multiple restrictions and the way the polygon is created (polygon trim distance, polygon simplification tolerance).
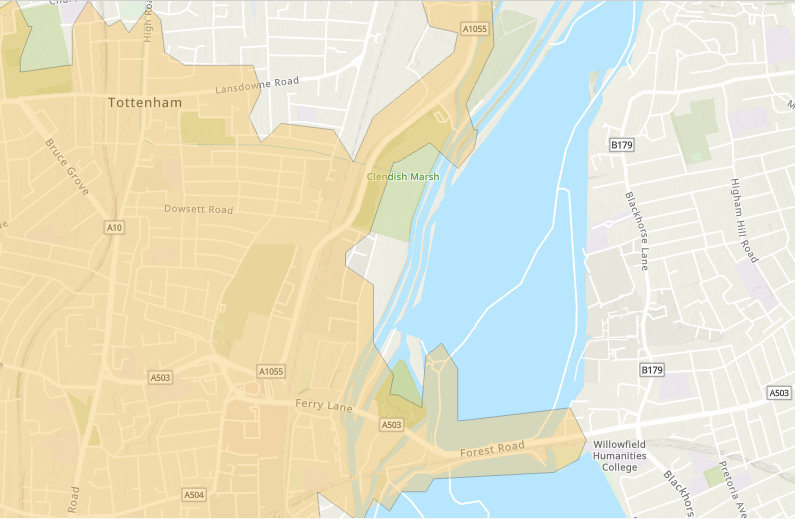
Because there are many parameters to the tool, the results are very refined. If you look closely at the close-up image below, you can see that the isochrones follow geographical boundaries and features such as roads very closely:
Isochrone performance
The image above shows that it took the tool 12 seconds to create and draw the multiple isochrones.
Available transport modes
If we open the tool and click “advanced analysis”, we can define the transport mode under “restrictions”. The default option is “driving an automobile”, but other options are driving a motorcycle, bus, taxi, truck, emergency vehicle or simply walking.
Pricing
The price for creating a single service area is 0.5 ArcGIS Online Credits, which translates to $0.05. Of course you need to pay for Esri software and cloud infrastructure too to be able to use the service, so that the overall price will be higher.
Hqgis
We chose the Hqgis plugin for creating isochrones inside QGIS. Hqgis is a python-based plugin for QGIS that offers access to the HERE API and combines different traffic/routing/geocoding actions in one plugin. Here is a 45-driving isochrone map for a geocoded point in Central London:
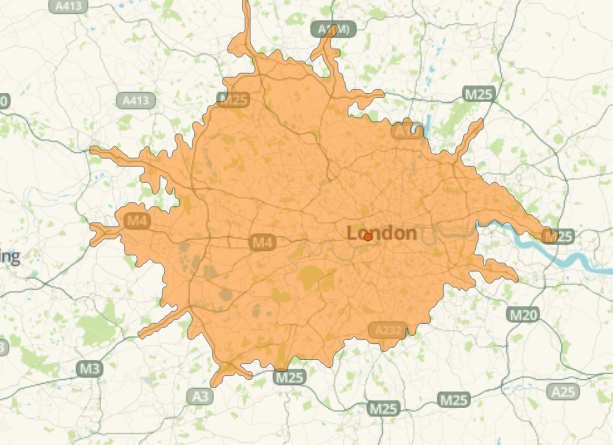
Driving models
Isochrones, or lines of equal (travel) times are calculated using different modes and types as well as for different times of the day. This can be done for a single address/map point or using a point layer. The plugin requires a HERE API key, which I was able to get for free after creating one here. After signing up, you need to get credentials for using HERE’s Location Services REST APIs. The API credentials need to be loaded in the plugin, after accessing the plugin through the Web tab in QGIS.
On HERE’s REST APIs webpage, you get an overview of the data that their REST APIs provide. I assume for this particular plugin, multiple APIs will be called, including the Routing API and the Traffic API.
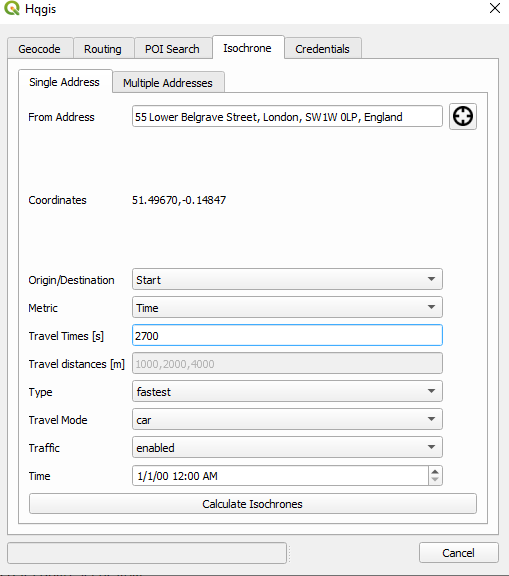
Looking at the required tool parameters, we see that the tool requires one or multiple addresses, an origin or destination, metric (time or distance), travel time in seconds, travel distance in meters, an isochrone type (fastest, shortest or balanced), traffic (enabled/disabled), travel mode and date/time. For a 45-minute car drive with traffic enabled from the Central London geocoded Point address, the parameters will look like this:
How the polygons are drawn
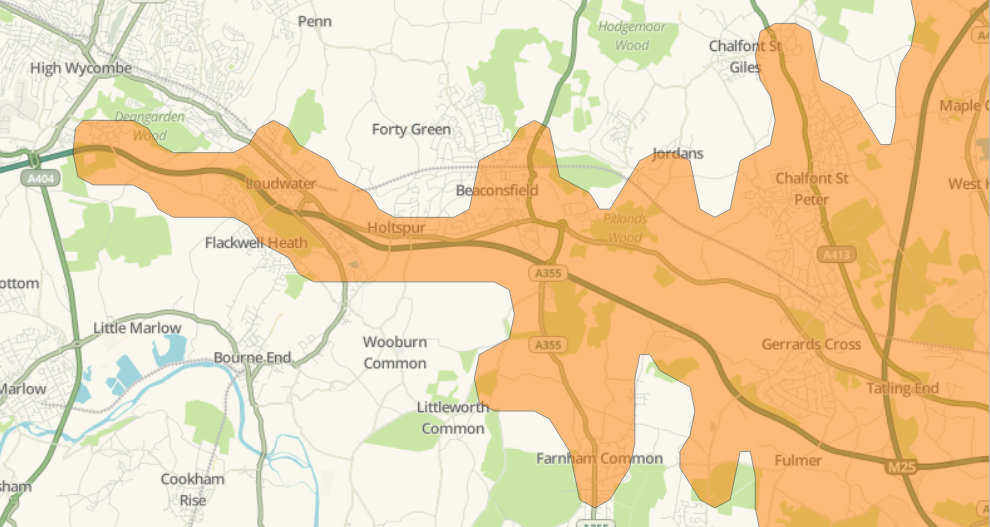
A detailed look at the map shows that the resulting polygon has many vertices and follows the underlying road data quite accurately:
Isochrone performance
The API works quickly and the results are added to the map instantly.
Available transport modes
There are four available transport modes for creating isochrones: car, car hov (high-occupancy vehicle lane), pedestrian and truck.
Pricing
The pricing here concerns the HERE REST API usage when creating isochrones. The Freemium plan includes 250k data transactions for API calls in HERE Locations Services. There’s an Add-on option for €45 per month and Pro license for €449 per month, including 1 million Transactions per month.
A closer look at the features of all three solutions
Now that we’ve covered the three different solutions, let’s have a closer look and compare what is possible with each solution. The schema below offers a comparison per solution provider for various isochrone functionalities. Notice that only TravelTime supports public transport data, multimodal and cycling isochrones:
| Functionality | TravelTime QGIS plugin | Esri (Generate Service Areas tool) | Hqgis QGIS plugin |
| Calculate isochrones from manually entered address | Yes | No | Yes |
| Calculate isochrones from a dropped pin | Yes | No | Yes |
| Calculate distance isochrones (as well as time) | No | Yes | Yes |
| CarHOV isochrones | No | Yes | Yes |
| Truck isochrones | No | Yes | Yes |
| Public transport (and combinations of) isochrones | Yes | No | No |
| Cycling isochrones | Yes | No | No |
| Walking isochrones | Yes | Yes | Yes |
| Create Union and Intersection isochrones from multiple locations | Yes | Yes | No |