
The science of photogrammetry has been developing for more than a century. Initially being fully analogue, it is gradually being digitalized for the past 30-40 years. Back then, it was a field understood and practised by a fairly small and closed group of engineers. The data was used mainly by governments and the military, and it was extremely expensive.
Today, the science of photogrammetry is in a totally different place due to the rise of drones over the past 7-8 years. Photogrammetry is now practised every day by hundreds and thousands of people around the world. They fly drones, capture the data, and process it seamlessly to get orthomosaics and Digital Surface Models (DSM). This helps them greatly in farming, construction, urban planning, energy, mining, and many other sectors. The drones and so-called “low-altitude photogrammetry” is ubiquitous.
The important terms
What I’ve noticed, though, is that when you commoditize a field of engineering, the previous scientific terms start to live their own lives. Also, I have noticed that some of these terms have slightly different meanings in different languages. Below I will try to define some key terms that you may see out there. Some of the terms apply mainly to traditional photogrammetry and some apply more to the low-altitude photogrammetry. Don’t worry, I will explain it all to you!
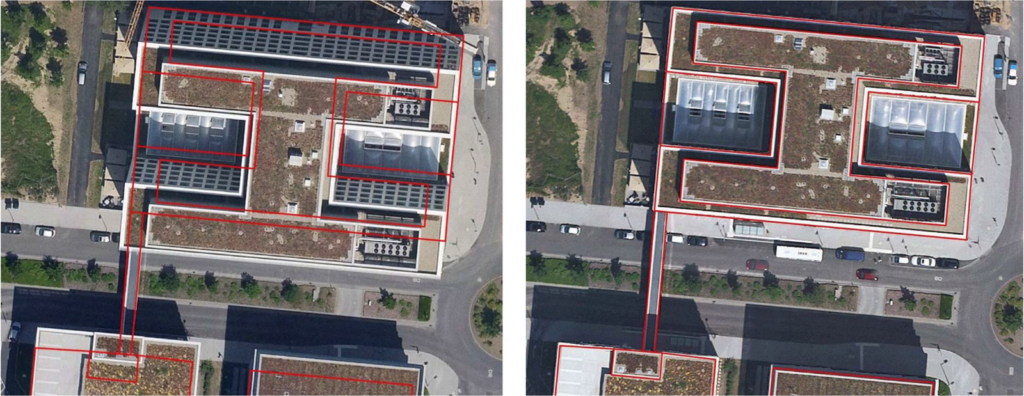
Orthophoto (left) vs. True orthophoto (right). source: nFrames SURE Software
Orthophoto:
Firstly, Orthophotos are an effect of photogrammetry processing that uses the Digital Terrain Model (DTM), typically seen in traditional airborne photogrammetry. In orthophotos, you will often see an effect where the terrain representation is very accurate, but you will see a tilt in the buildings and other tall structures, which is an effect of using DTM that only maps the natural shape of the earth (excluding vegetation and all man-made objects and structures).
True Orthophoto:
True Orthophoto, on the other hand, is processed using Digital Surface Model that maps every shape and object visible on the ground (including vegetation and man-made objects). True Orthophoto gives a vertical view of the earth’s surface, eliminating building tilting and allowing a view of nearly any point on the ground.
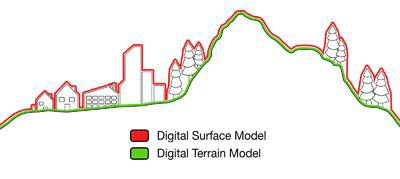
Traditionally measuring Digital Surface Model has been extremely difficult and expensive. It is typically done using LiDAR or ground measurements. On the other hand, Digital Terrain Models were widely available based on generalized countrywide elevation models. Therefore, True Orthophotos used to be very expensive to make and hardly available. These two products typically refer to the traditional airborne photogrammetry because, according to the standards in many countries, they are required to be done using a metric camera and perfectly nadir images. It is, however, typically not the case in low-altitude drone photogrammetry.
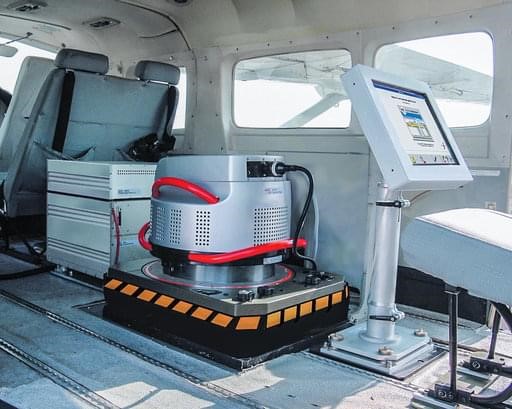
Example of Leica ADS40
Orthomosaic:
The product of drone photogrammetry is typically called orthomosaic. In reality, an orthomosaic is similar to True Orthophoto (as it is generated using Digital Surface Model), but typically not based on a metric camera (in which focal length and internal dimensions are precisely known and calibrated), as these are expensive and not widely available for UAVs. Additionally, orthomosaics can be generated based on both nadir and oblique imagery.
Drone-based Orthomosaics are generated based on the Digital Surface Model which is not done as a separate survey as in the case for traditional airborne photogrammetry. In drone photogrammetry, the DSM is generated based on the 3D point cloud which is the initial product of the data processing. This technology is developed and used by Pix4D which monopolized low-altitude photogrammetry around the world.
In some geographies, orthophoto and true orthophotos that are entirely done according to local official standards (typically traditional airborne photogrammetry) should be submitted to national geodesy and cartography resource repositories. In these countries such data is accepted as official geodesy and cartography documentation, which might have consequences, e.g. when using the data in court.
Orhophotomap by U.S. Geological Survey
Orthophotomap
Last but not least is the term known as an orthophotomap, which is very often used interchangeably with orthophoto and orthomosaic. However, the literature review says that it should be defined as orthophoto transformed to digital or printed map format, which typically has map elements such as map grid, scale, north arrow, title, etc.
The EndNote
I hope that this post clears a bit of the terminology to those who are confused. Please let me know in the comments if this is how you define these terms in your country or if there are any differences. I look forward to opening this discussion and seeing your comments.
Did you like the article? Read more and subscribe to our monthly newsletter!

#

Next article
ESA releases multi-year biomass maps to keep tabs on climate change

Tracking vegetation biomass change plays a crucial role in understanding the carbon cycle. And quantifying the global carbon cycle is essential for monitoring the numerous changes affecting our planet – especially those arising from the burning of fossil fuel and land-use change. This is why, as part of its Climate Change Initiative, the European Space Agency (ESA) has been actively researching vegetation biomass changes around the world.
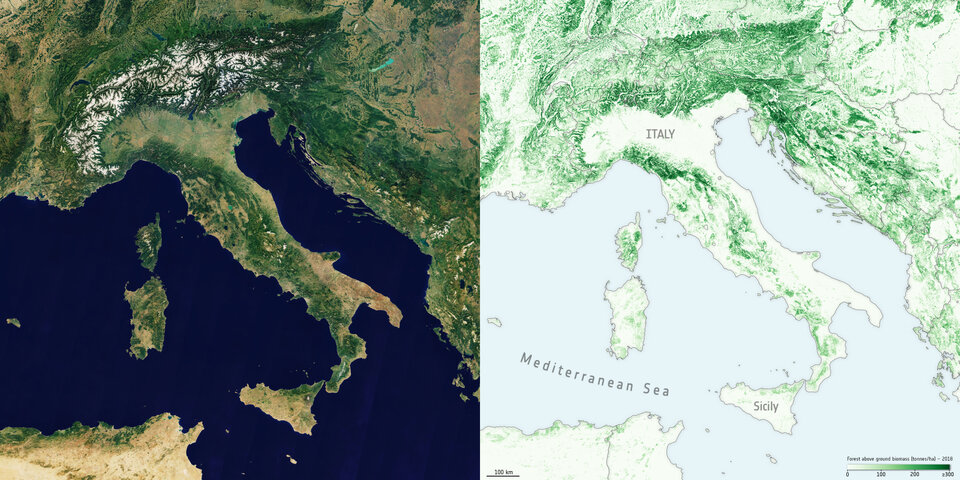
Today, ESA has released a series of new maps that provide a global view of the above-ground biomass distribution and spatial density over three separate years – 2010, 2017, and 2018.
These maps, provided at a 100 m resolution, have been created using a combination of satellite data from the Copernicus Sentinel-1 mission, Envisat’s ASAR instrument, and JAXA’s Advanced Land Observing Satellite, along with additional inputs from other Earth Observation sources.
The work, however, is far from finished. You cannot quantify the biomass changes over the last decade simply by subtracting the current maps. Since the data has been captured by sensors of different generations under different missions, the issue of temporal consistency between the different years still needs to be addressed.
The map of Italy on the right shows the above-ground biomass data from 2018. The optical image on the left shows the same view of Italy and the surrounding countries. Credit: ESA
For this, the research team is actively working on integrating additional low geometric resolution data streams into its algorithms. The new data could include the L-band vegetation optical depth from ESA’s Soil Moisture and Ocean Salinity satellite as well as scatterometer data from Eumetsat’s Metop satellite.
According to the team’s science leader, Shaun Quegan, “Combining these new data is anticipated to increase the consistency of these high-resolution maps, and move a step closer towards tracking changes and direct estimation of gross gains and losses of above-ground biomass at scale.”
Then again, vegetation biomass is a crucial ecological variable for understanding the evolution and potential future changes of the climate system, on a local, regional, and even global scale. And even in their current form, the maps could still allow scientists to undertake trend analyses, such as understanding the impact of regional climate phenomena such as El Niño on biomass dynamics.
Interestingly, ESA plans to launch a new Earth Explorer Biomass mission in 2022. This mission is being designed to provide, for the first time from space, P-band synthetic aperture radar (SAR) measurements to determine the amount of biomass and carbon stored in forests. The mission will also have an experimental ‘tomographic’ phase that would provide 3D views of the earth’s forests.
Did you like the article? Read more and subscribe to our monthly newsletter!