
Founded in 2015 by Max Polyakov, EOS Inc. (EOS stands for the Earth Observing System) developed one of the best satellite data processing and analytics platforms out there. EOS’s back-end solutions are used by some of the Fortune 500 companies and the mapping industry leaders.
The platform offers the fastest engine to search and process satellite and areal imagery I’ve ever seen. On the top, it features a massive set of filters and algorithms to analyze the data at any scale. Now, all these features are available for free to the general public. The company recently launched a new, impressive web-based tool where anyone can access, analyze and download satellite images for free.
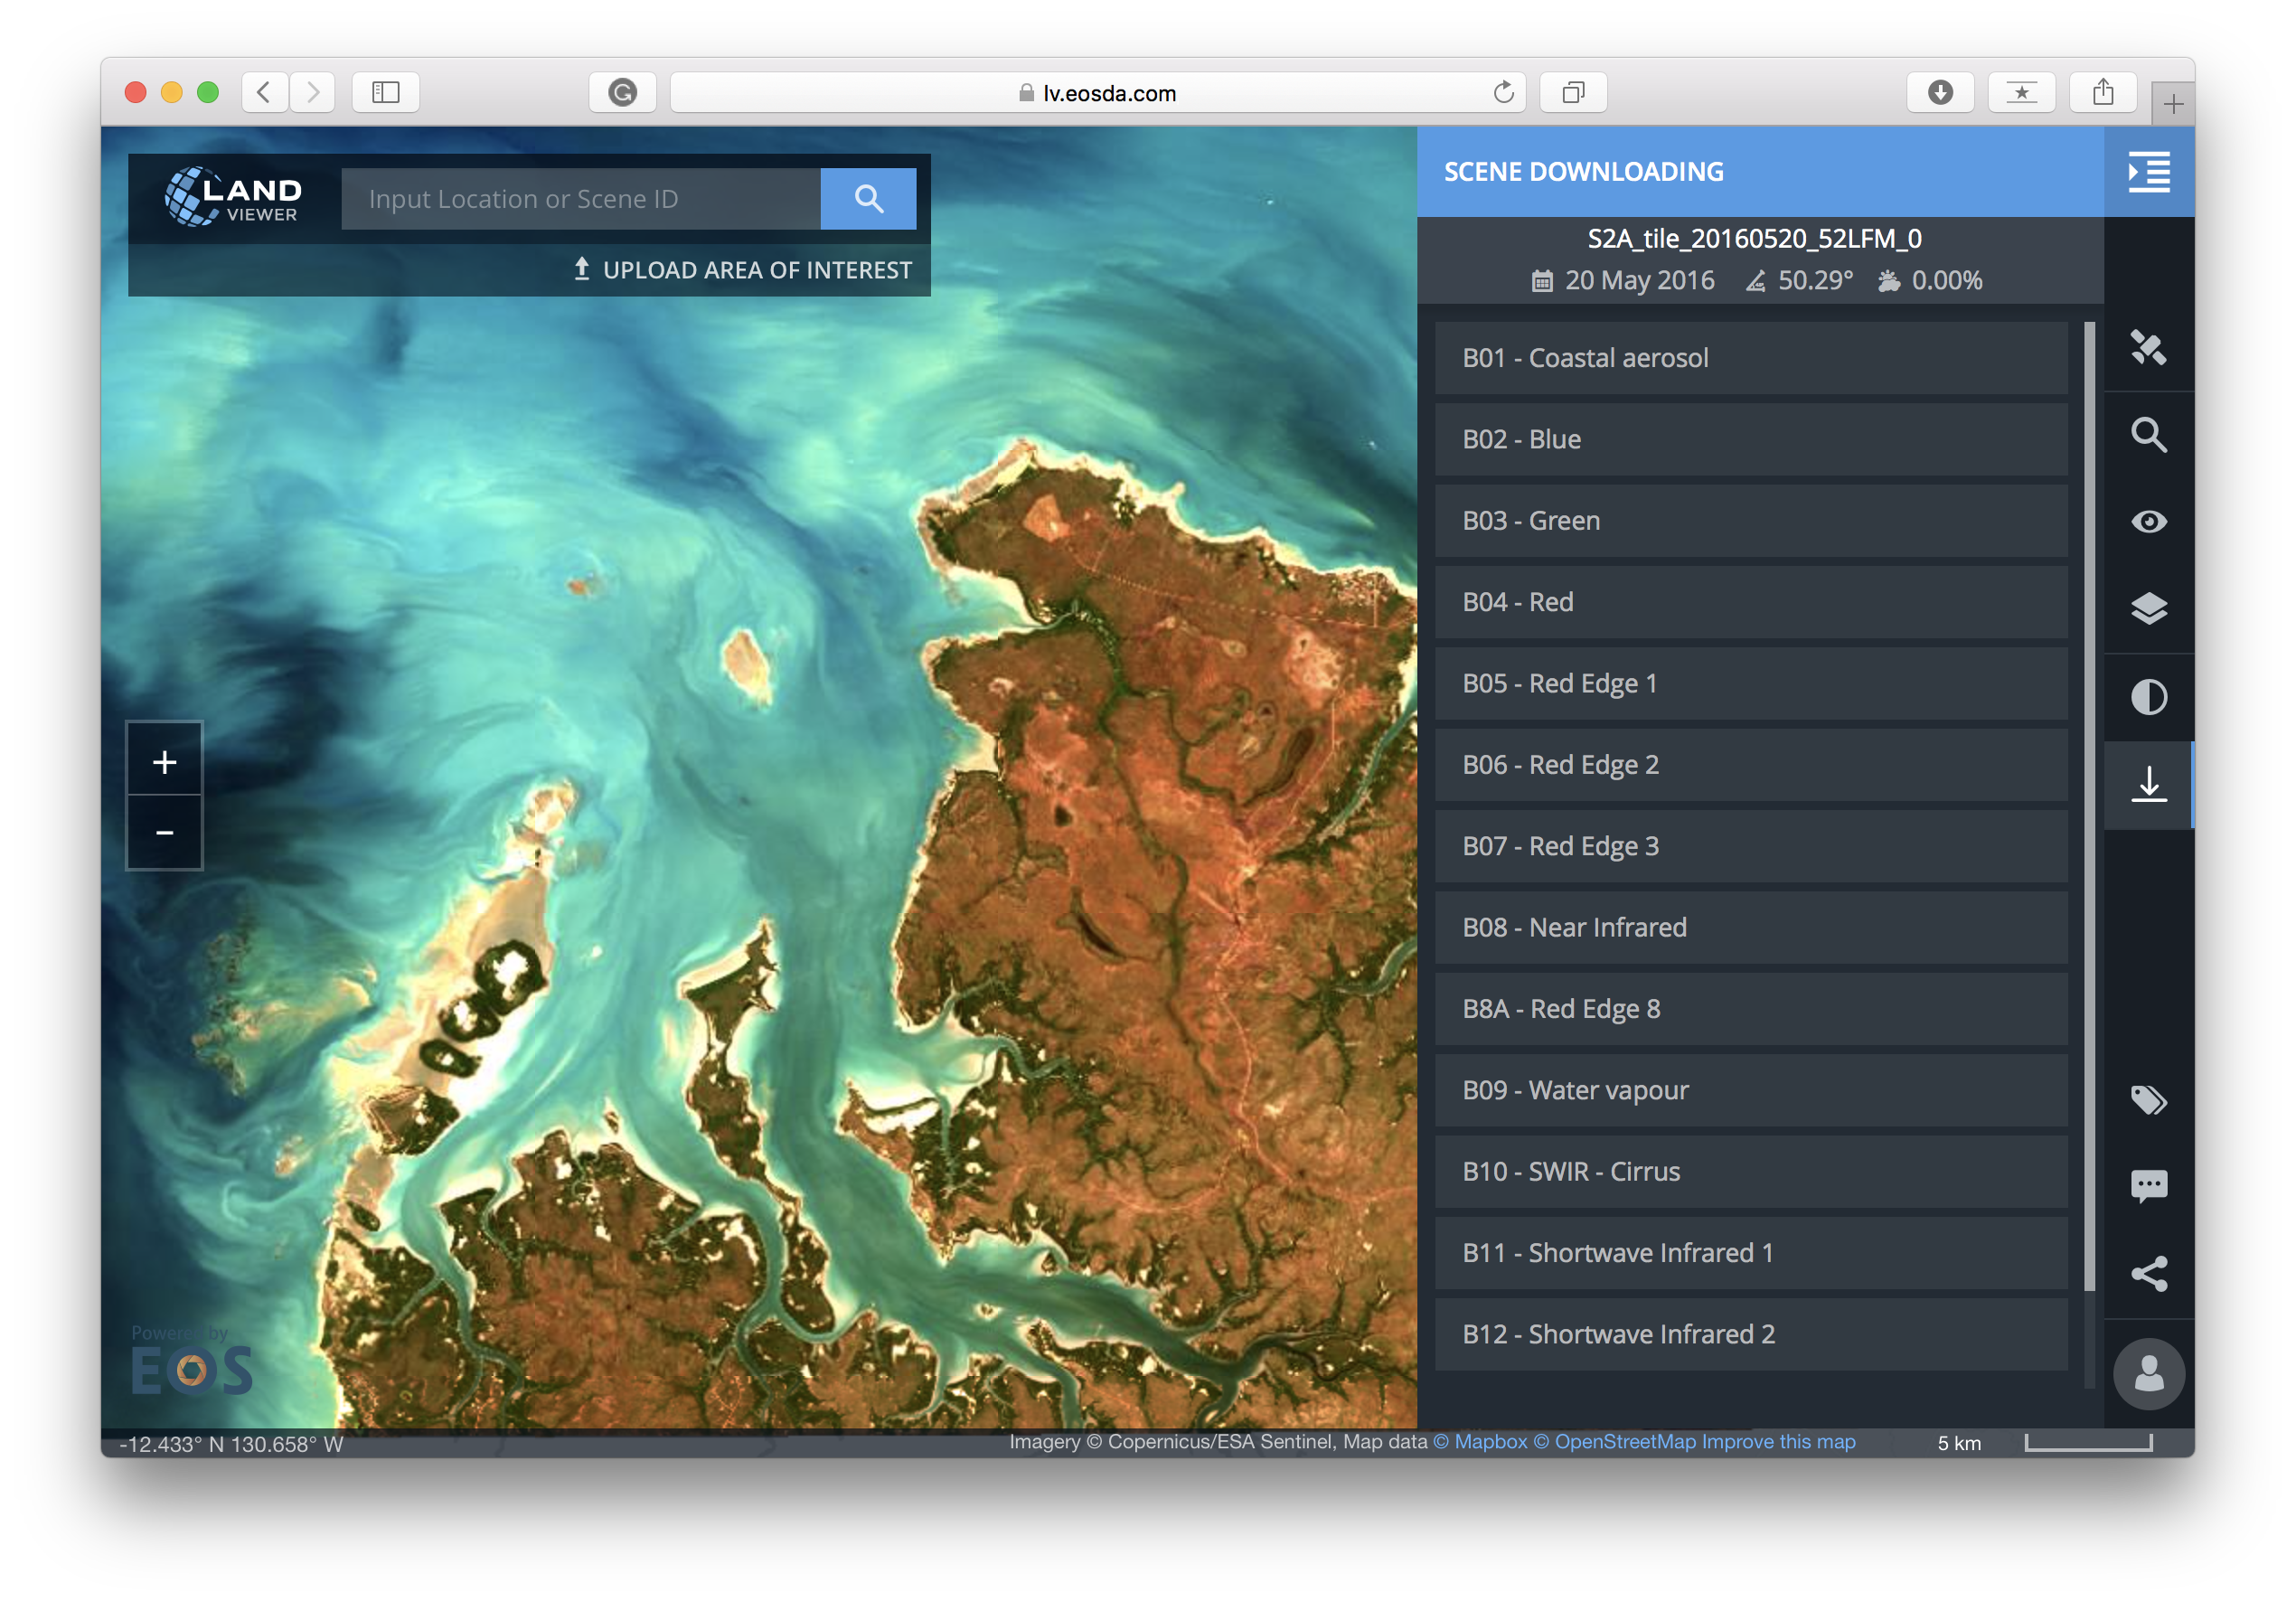
The service is called Land Viewer and offers free, on-the-fly, real-time imagery processing and analytics packed with features. It’s cool and insanely fast. It gives you access to imagery from Landsat 8 and Sentinel 2 satellites with more to come soon.
Filtering per time and geography
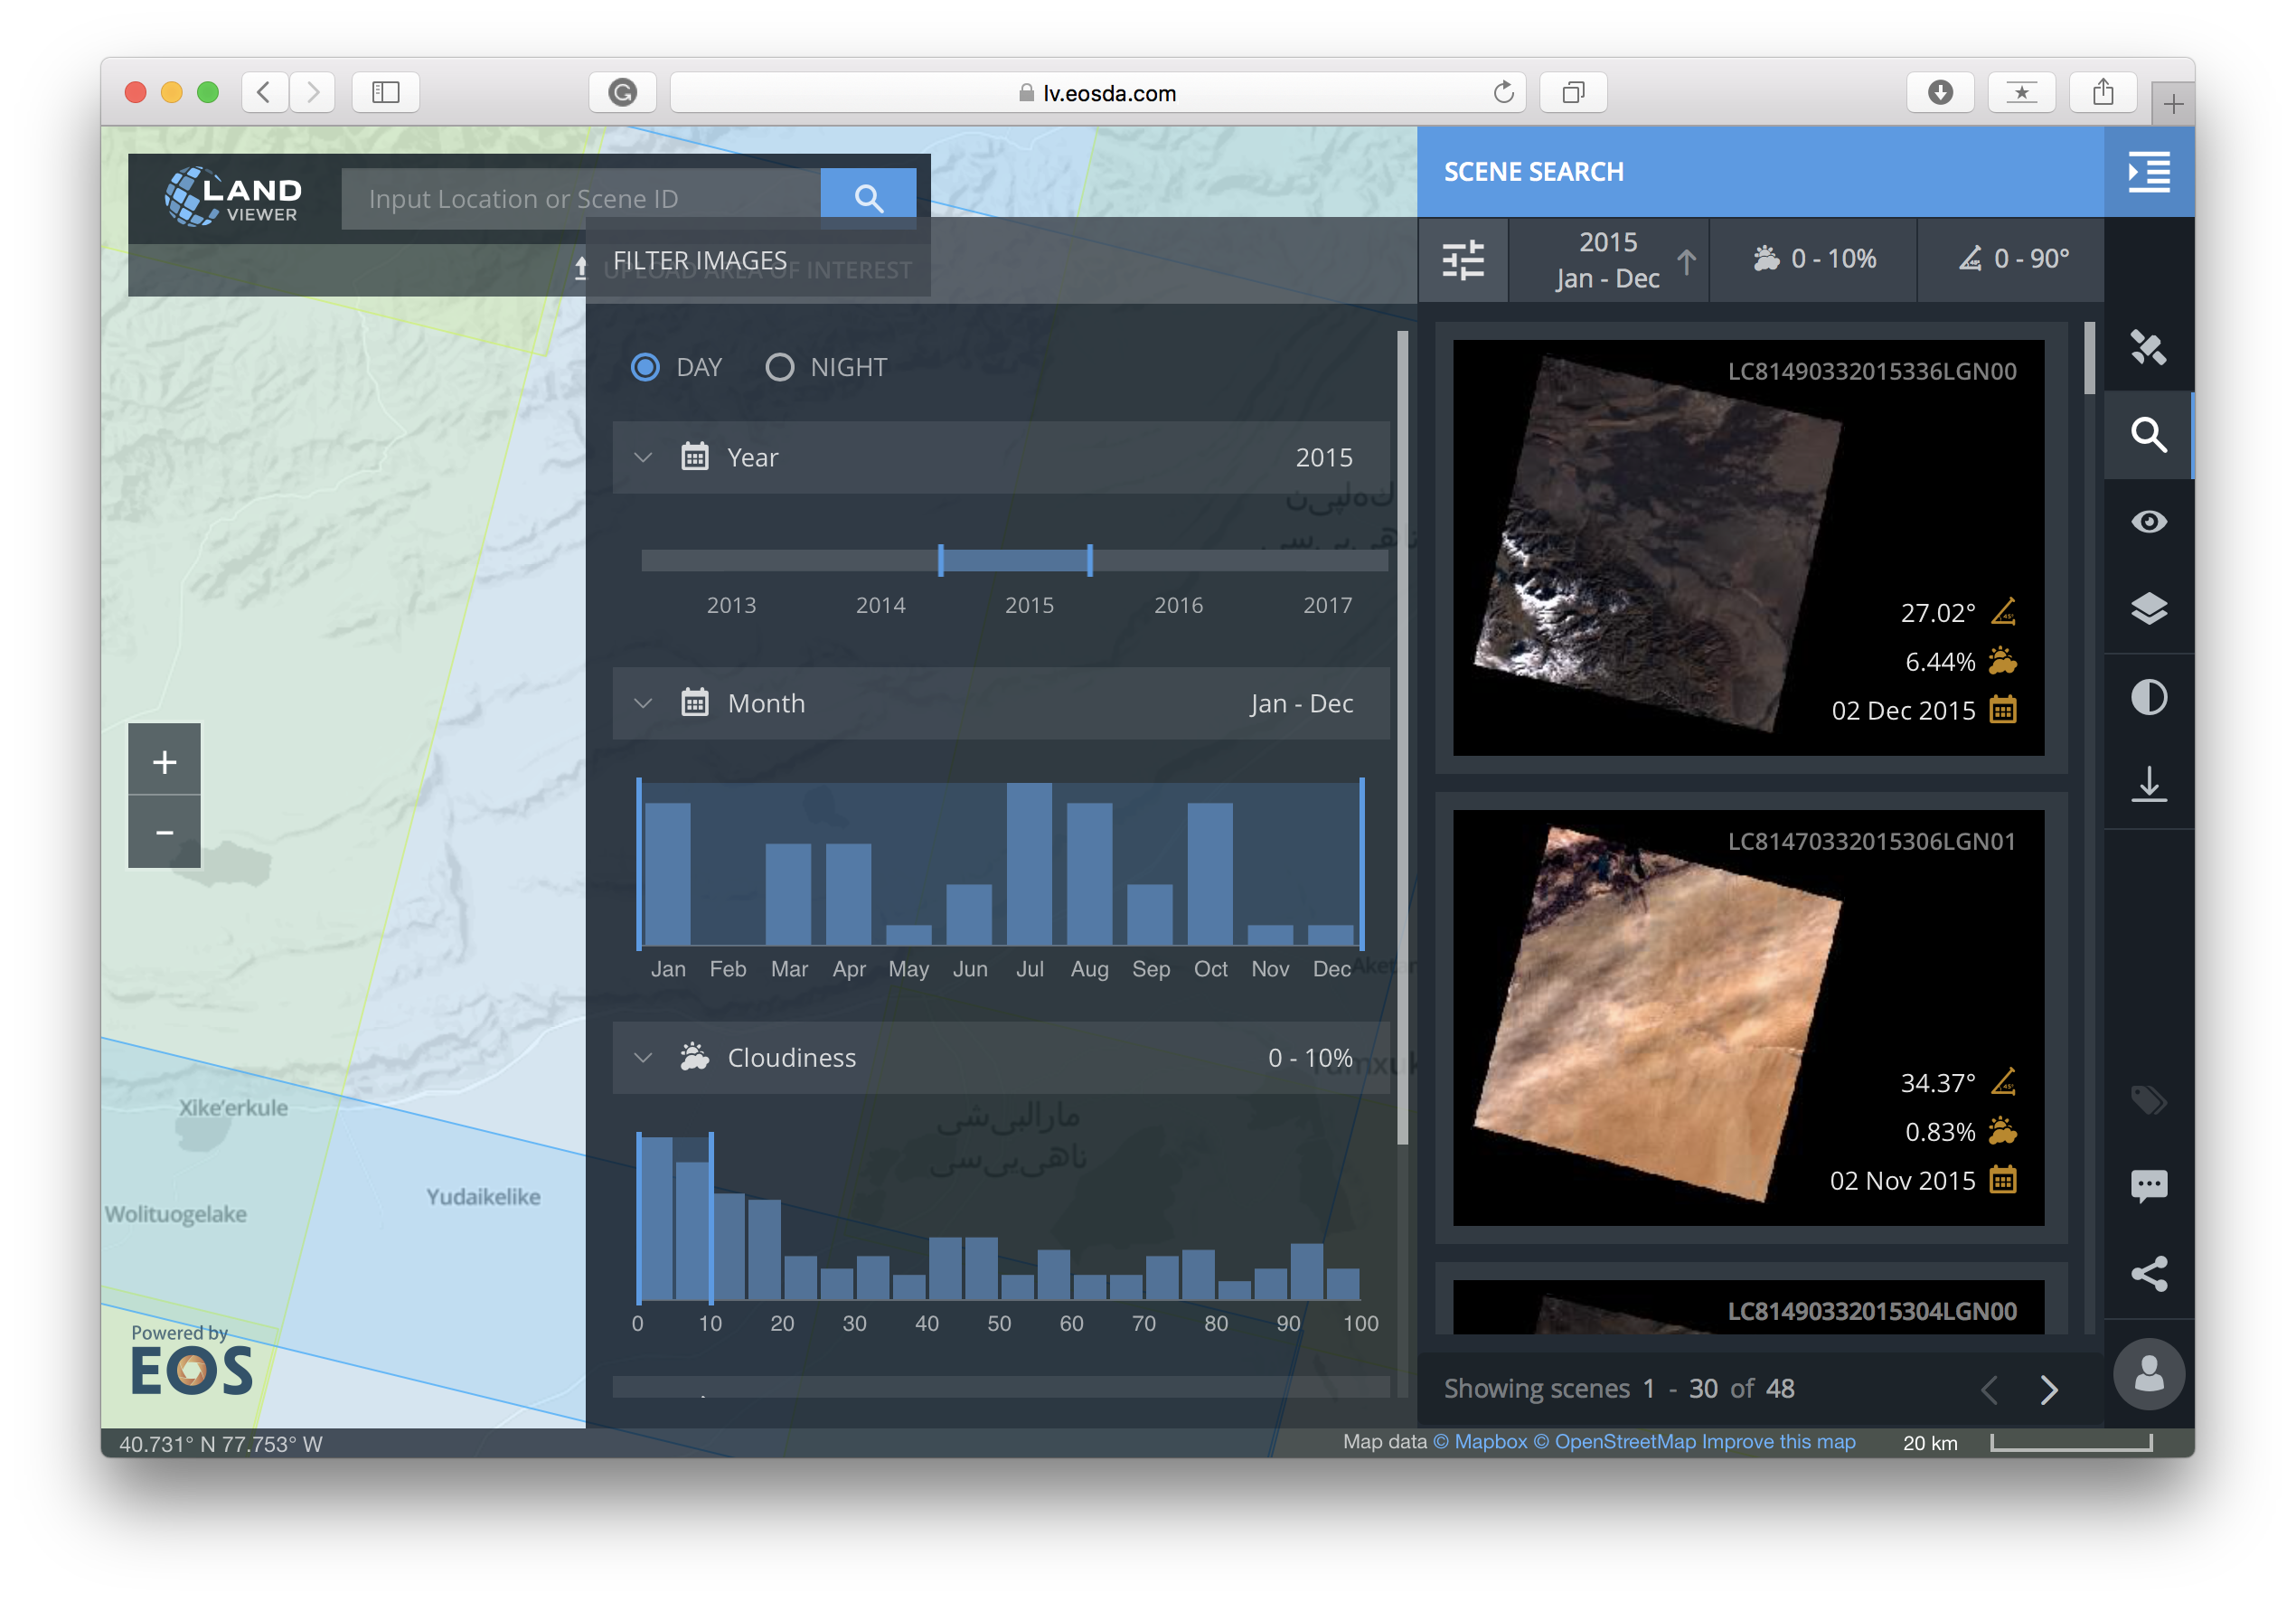
Browsing satellite imagery per geography is nothing spectacular, but none of the solutions on the market let you so easily filter the data based on time. Land Viewer gives you access to a massive set of historical data which you can easily discover using a handy timeline. You can choose Day and Night images and even parameters like cloudiness and sun elevation.
Advanced filters
Once you select your image, you can use a library of filters that will allow you to analyze the data according to your needs. EOS gives you access to 18 filters and a possibility to compose one yourself.
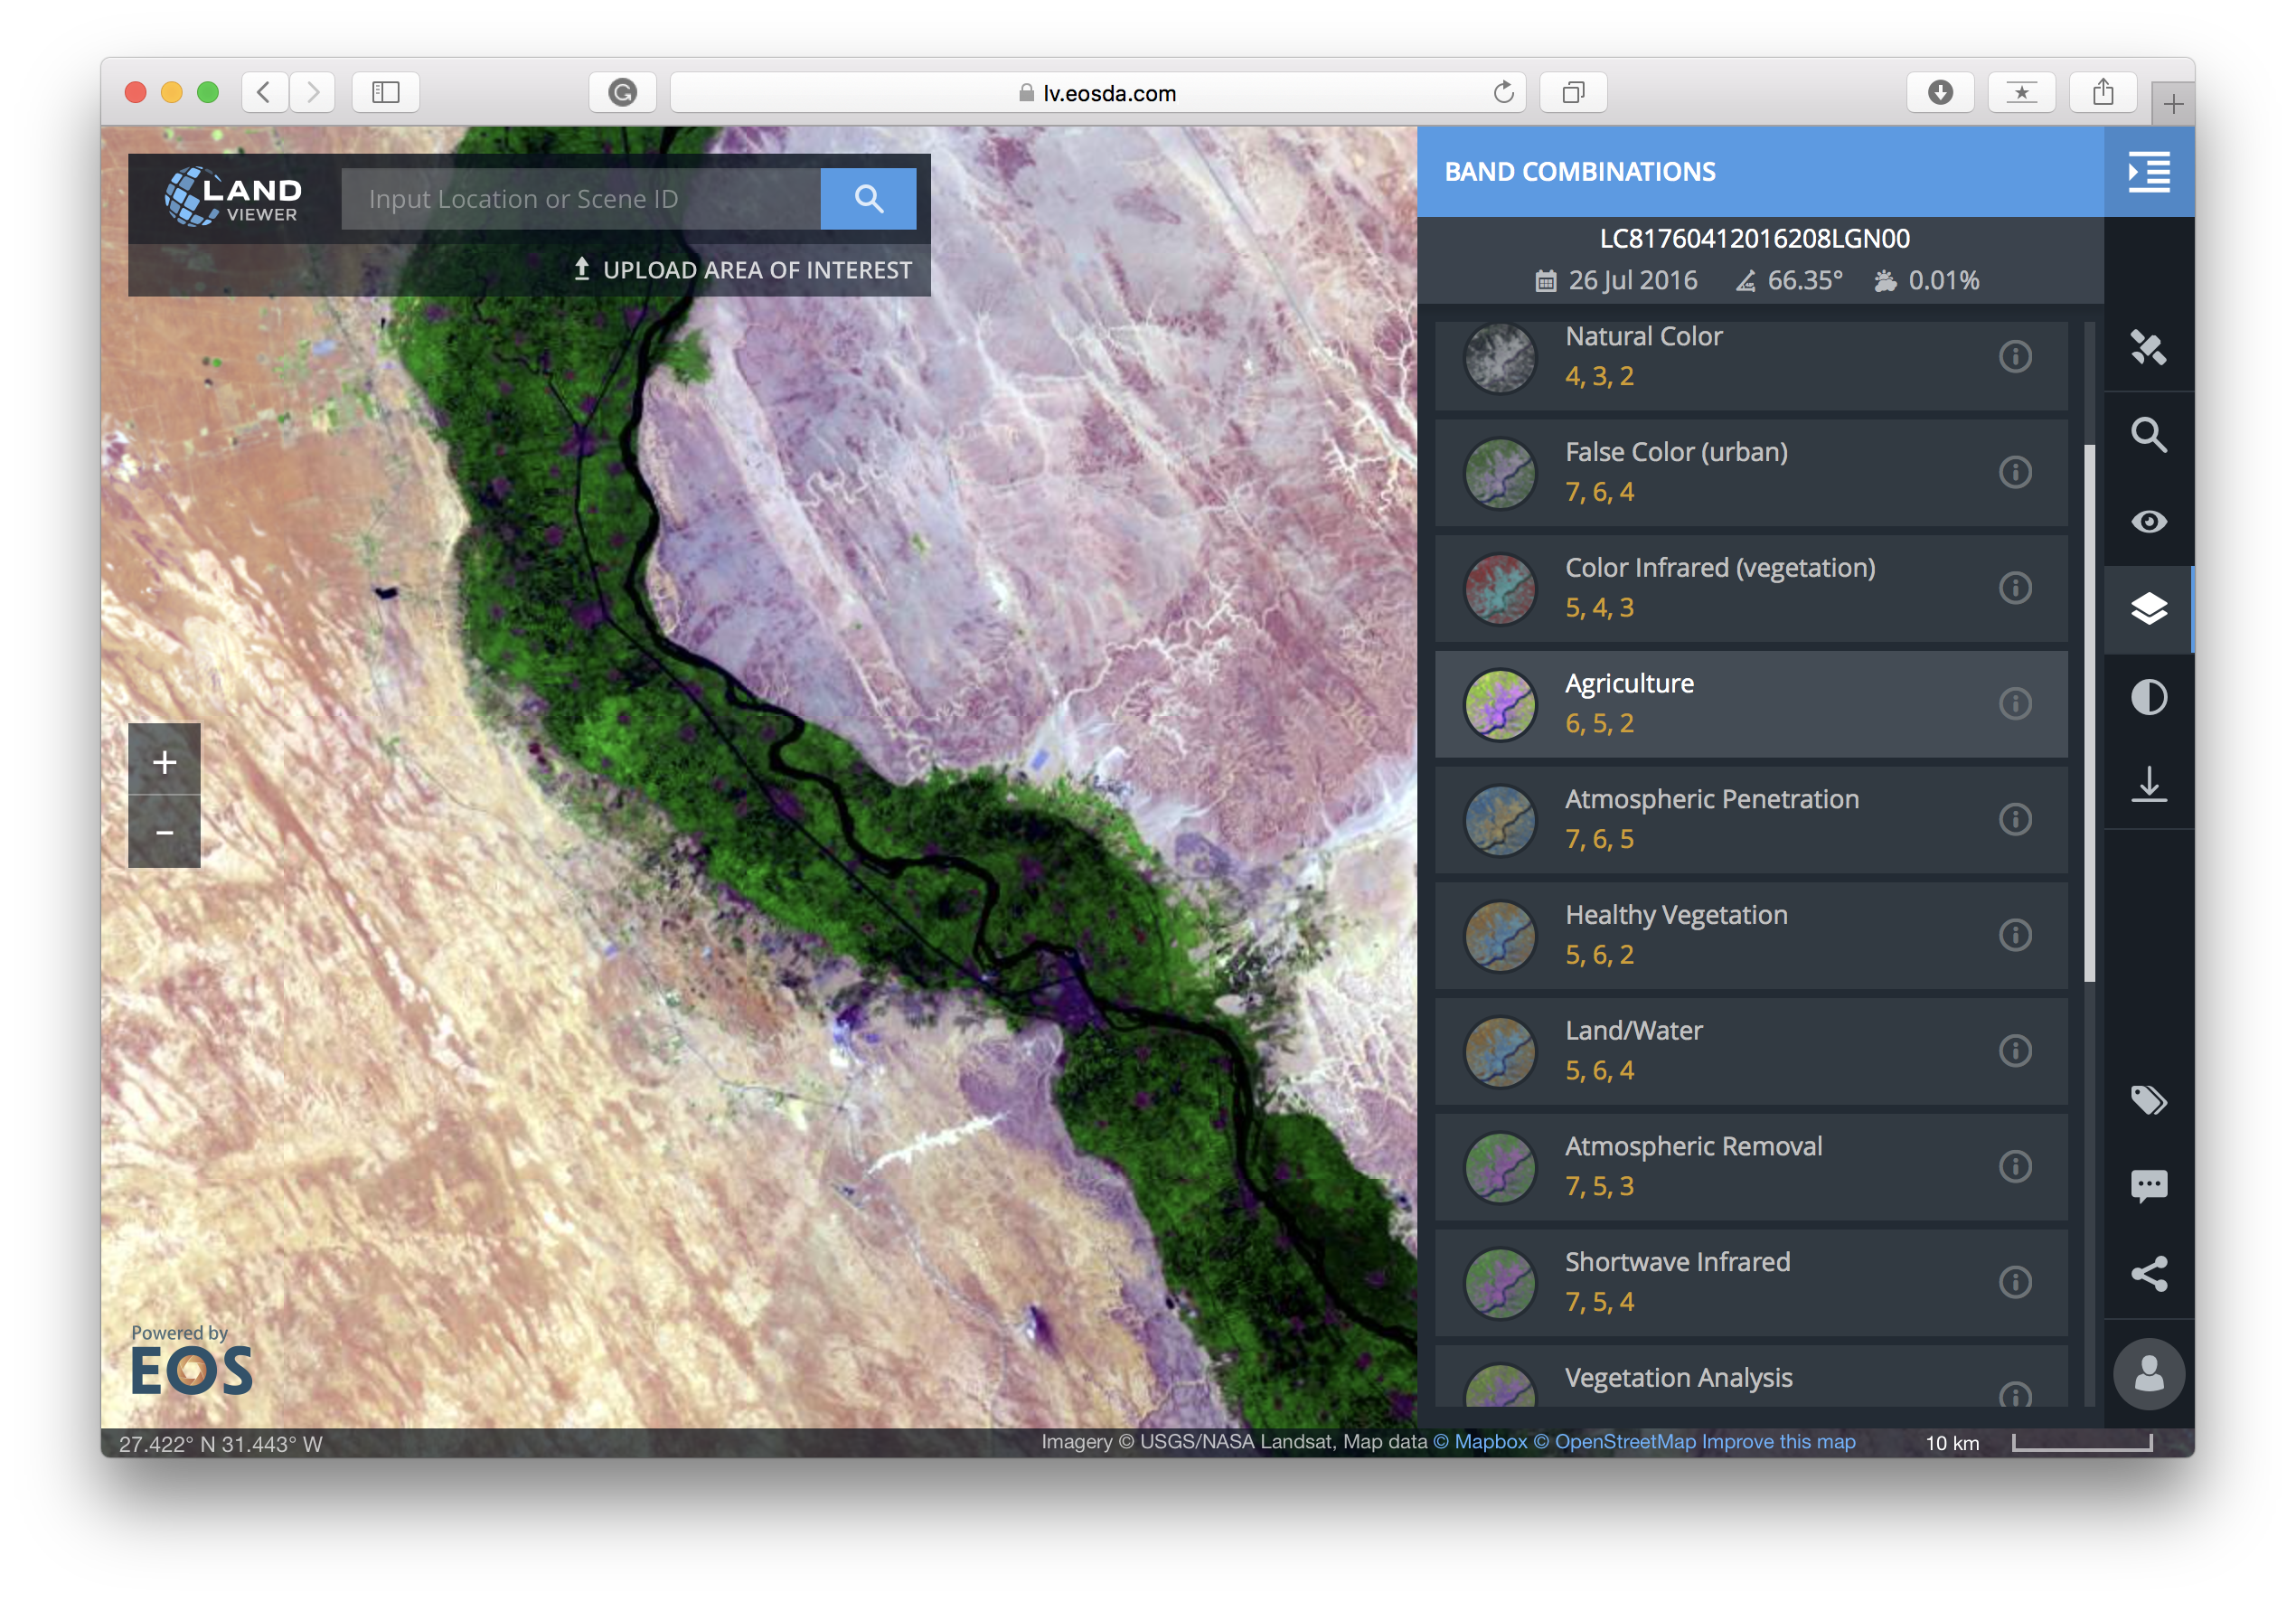
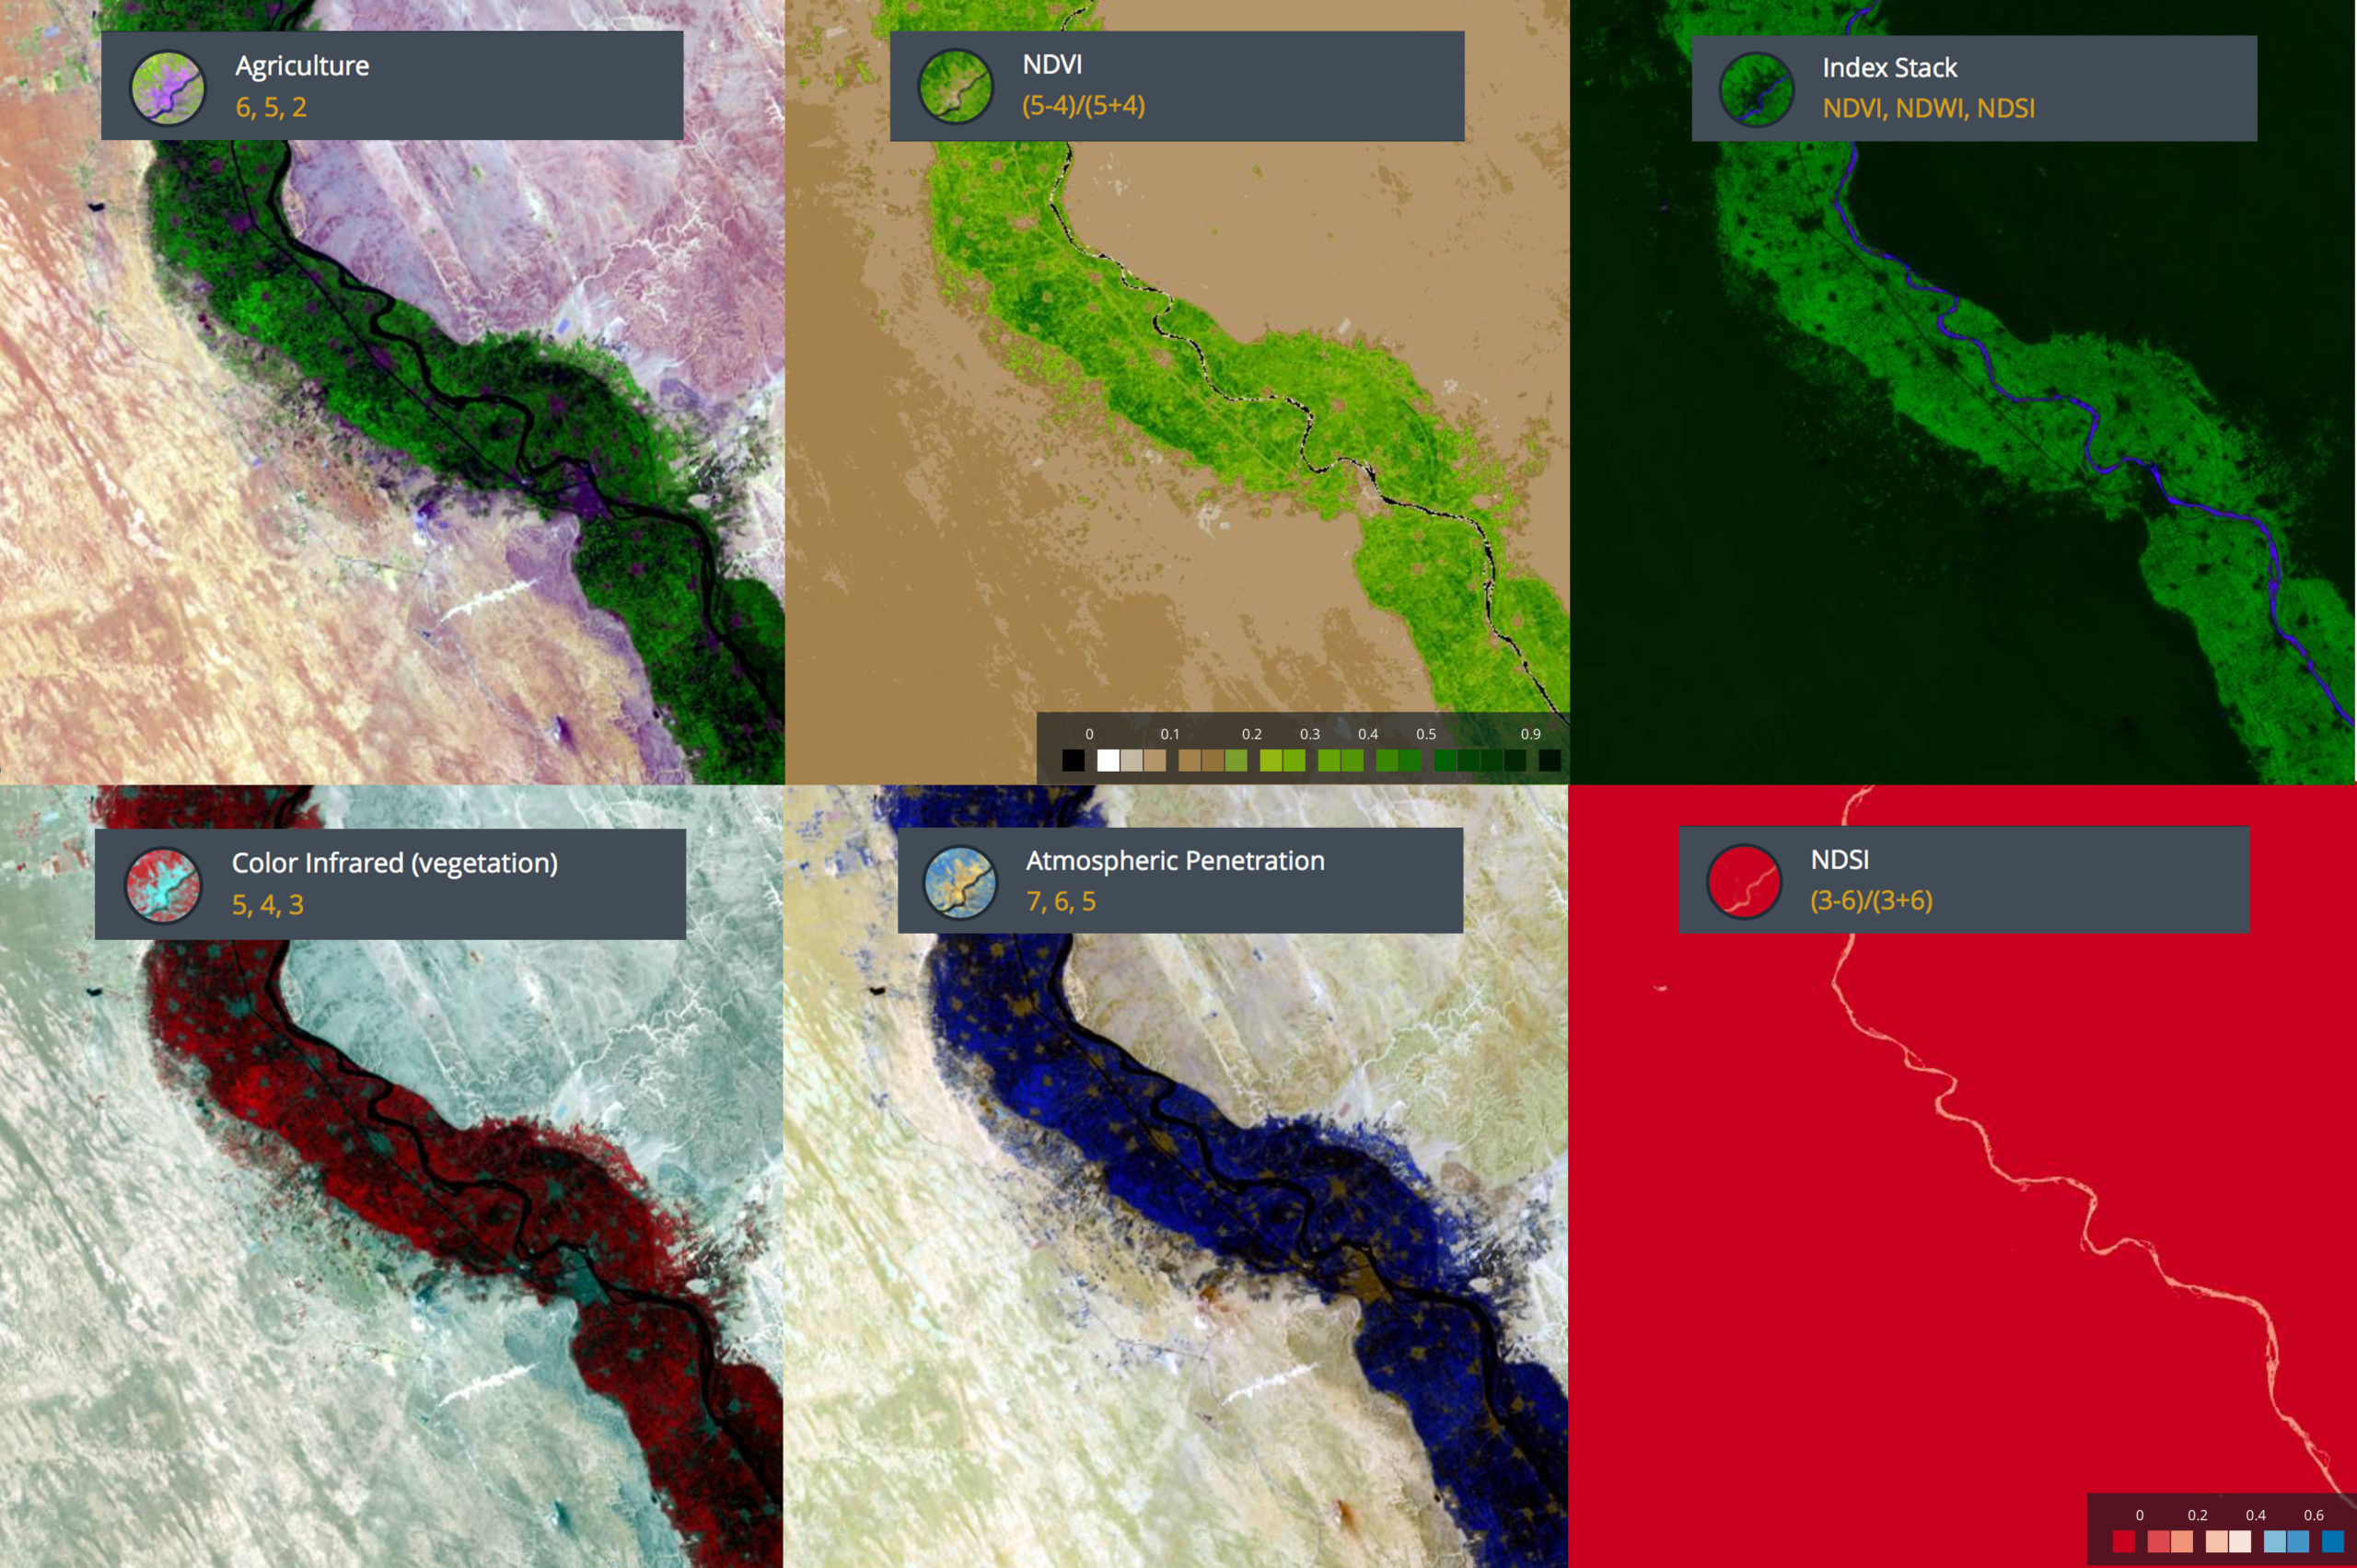
The set of free-of-charge filters is the best feature of the service. It gives you an instant access to popular algorithms like NDVI or Infrared but you can also use some of the EOS proprietary filters designed for a particular use case e.g. Agriculture, Land/Water and other.
Fast processing
The tool is insanely fast! While being used to work with the desktop software I was always used to waiting for the effects. Land Viewer gives you the results almost instantly. I don’t know how they’ve done it but it works. You can find, display and apply filtering to any satellite scene all within 10 seconds. I didn’t expect it.
Download free of charge
And finally, you can download any selected satellite scene in a GeoTIF format in order to use it in your project. The data can be downloaded per band giving you full control of the image.
Final verdict
EOS did a great job! Land Viewer is the only such advanced satellite data analytics web tool available for free. It is packed with features but easy to use at the same time. And oh boy, this thing is fast. So if you need to do a quick analysis of remote sensing data don’t look any further.

#

Next article

For farmers and land managers, increasing crop yields and reducing costs while minimizing environmental pollution is a constant challenge. To accomplish this goal, many farm managers are looking for new technologies to help them decide when and where to irrigate, fertilize, seed crops, and use herbicides. Using data collected by satellites combined with GIS environments, important agricultural factors like plant health, plant cover and soil moisture can be monitored from space and provide the bigger picture of the land surface that can be combined with other technologies like remote-guided machinery etc., to help reduce costs and increase crop yields.
The long term archiving of Landsat imagery, Copernicus data as well as from local ancillary data (e.g. DEM/DTM, meteorological measurements from ground weather stations, soil fertility measurements, etc.) and yield production datasets gathered in the field by farmers and agronomists present a new opportunity for entrepreneurs and agriculture stakeholders. Using the appropriate data fusion and machine learning techniques, these datasets can allow yield predictions with higher accuracy, spatial and temporal resolution. For example, by using different types of visual data representations (RGB composites, multitemporal NDVI indices), a farm operator can determine the issues affecting their crops and apply appropriate remedies to the affected areas.
Specifically, crop yield monitoring relies primarily on vegetation indices, such as the Normalized Differential Vegetation Index (NDVI), Advanced Vegetation Index (AVI), Normalized Difference Water Index (NDWI) in order to monitor crop phenology. By examining and analyzing multitemporal values of the NDVI indices, it is feasible to monitor the vegetation growth, the fruit/seed status and the maturity of each crop.
According to the chart below, a multitemporal NDVI analysis was performed using Landsat 8 products from Spaceye Platform, in order to identify the different crop species and study their phenological features in relation to their growth in the region of Illinois USA. We can see that the Soybeans during the summer period are on their highest growth, whereas the Fallow cropland is on its lowest growth. It can also be observed that it is feasible to accurately discriminate all the different types of crops in at least 3 different time periods between the time ranges of 05/2015 to 12/2015.
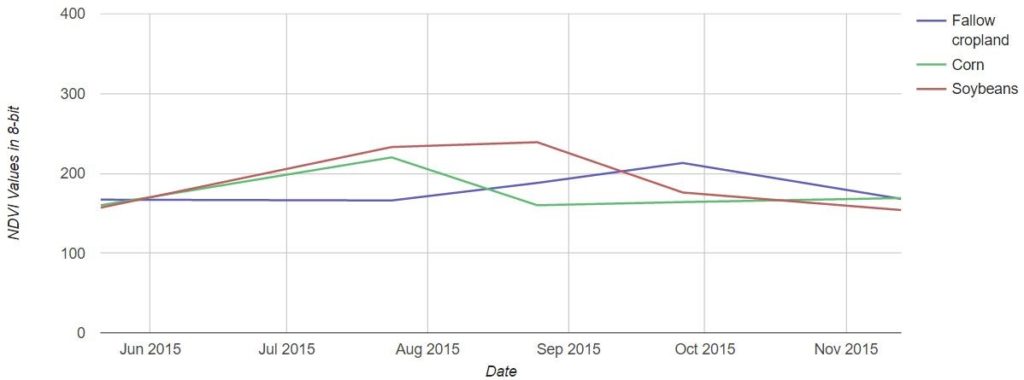
Source: SpaceAnalyer
Another use case from Sinergise demonstrating the usage of Sentinel data and NDVI indices in order to monitor the annual changes of agricultural production and vegetation development and health is illustrated below. Specifically, the green colored zones have the most robust and volume of vegetation while the yellow and red zones represent less vegetation. This information can be used to make management decisions on the application of inputs like fertilizer and fungicide.
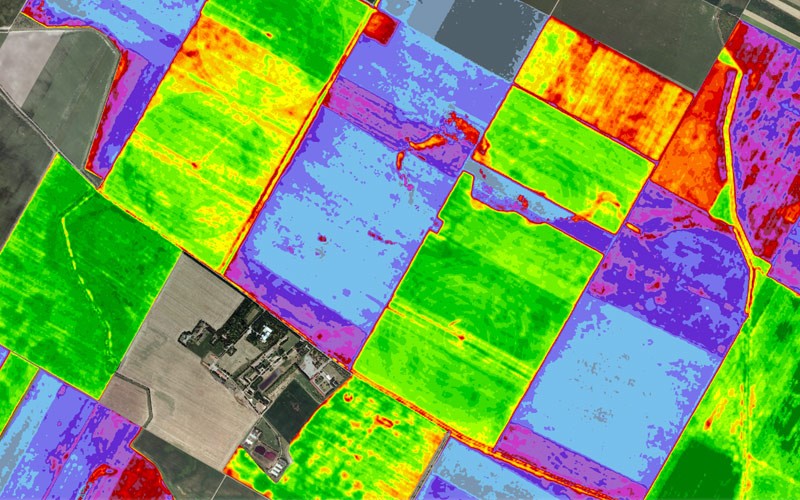
Precision farming – spectral imagery Source: Sentinel-hub
Finally, Planet’s high-frequency imaging satellites deliver a constant stream of current information making possible the multitemporal production of vegetation indices in order calculate the relative chlorophyll content and correlate it with vegetation vigor and productivity. The vegetation index displayed on the image below represents relative chlorophyll content, which correlates with vegetation vigor and productivity. The red tones represent low relative chlorophyll content while the green ones show high relative chlorophyll content.
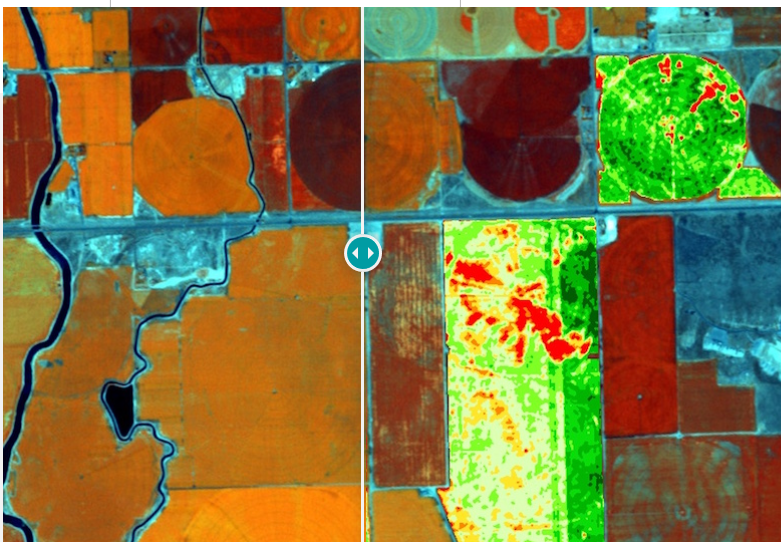
Precision farming – spectral imagery. Source: Planet Labs
In conclusion, the long archive of Landsat program (dated from 1984) allows us to perform robust time series analysis and examine the crop phenology in order to differentiate specific crop types. In addition, recent freely satellite data from Landsat 8 and Sentinel 2 as well as from Very High Resolution (VHR) satellites give us the ability to provide near real-time estimation of crops health, pinpoint signs of crop stress, monitor vegetation growth as well determine actual rates of evaporation.
Did you like the article about precision farming? Read more and subscribe to our monthly newsletter!