
When you think about viral content, maps are not the first thing that comes to mind. And yet, it is not uncommon to see maps of all shapes and sizes dominating social conversations about various issues – as well as non-issues.
In January 2020, the Australian bushfires were “the hottest” topic for every media. The artist Anthony Hearsey pulled publically-available satellite data about the fires from NASA and created a 3D rendering of all the fires that had been detected in a one-month period.
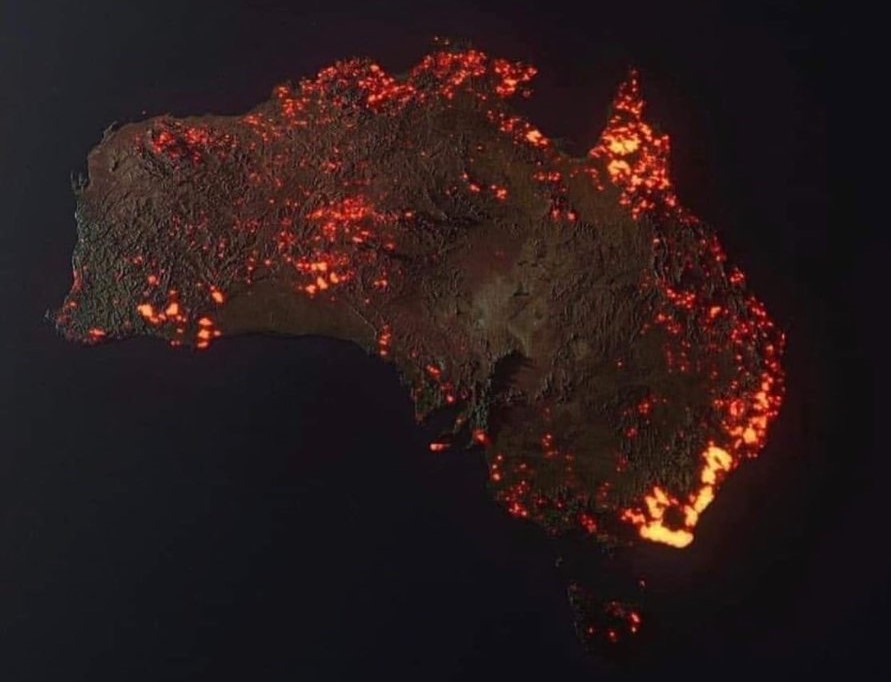
Courtesy: Anthony Hearsey
People mistook that compilation to be a recent satellite photo showing the live extent of the fire. Singer Rihanna put out a tweet of that visualization, and in no time, it had amassed 76,8000 retweets and comments. News organizations had to step in and clarify what that graphic actually represented.
But that’s just one example of a trending map. Virtually anything interesting could make up for the content of a viral map – if done correctly.
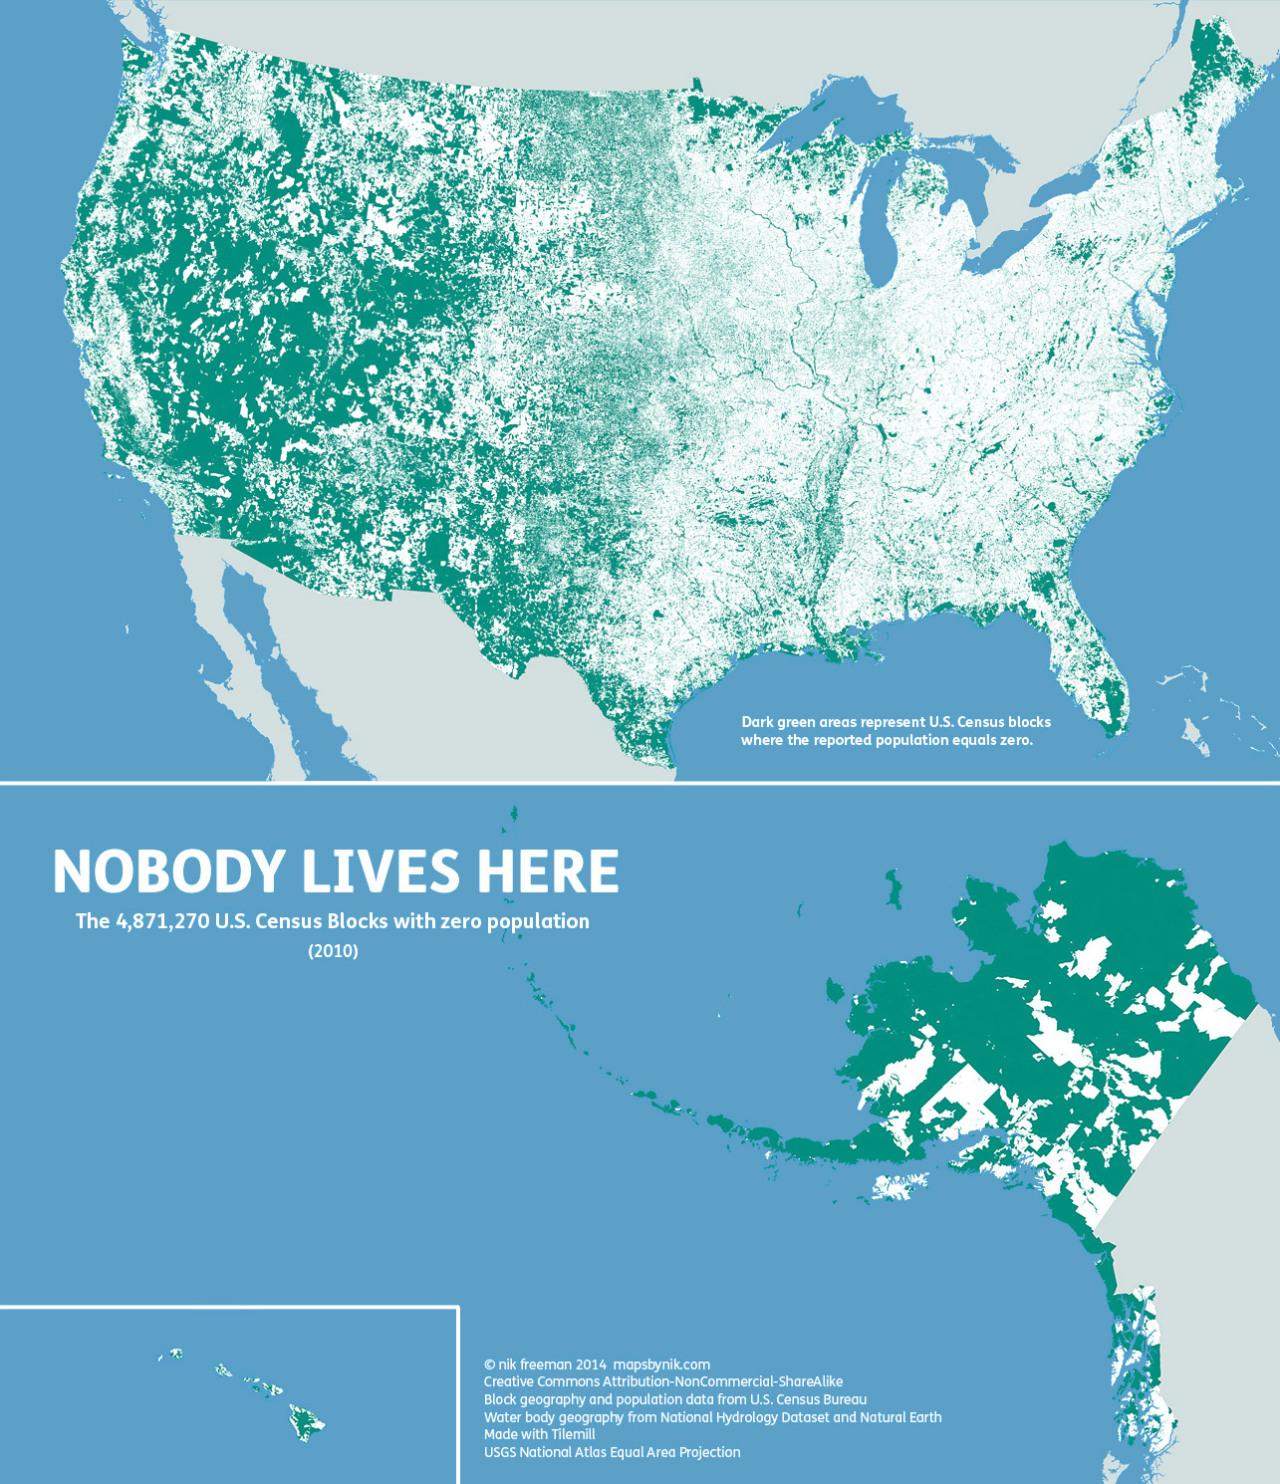
Like Nik Freeman’s map of the nearly 5 million Census Blocks in the United States where no one lives:
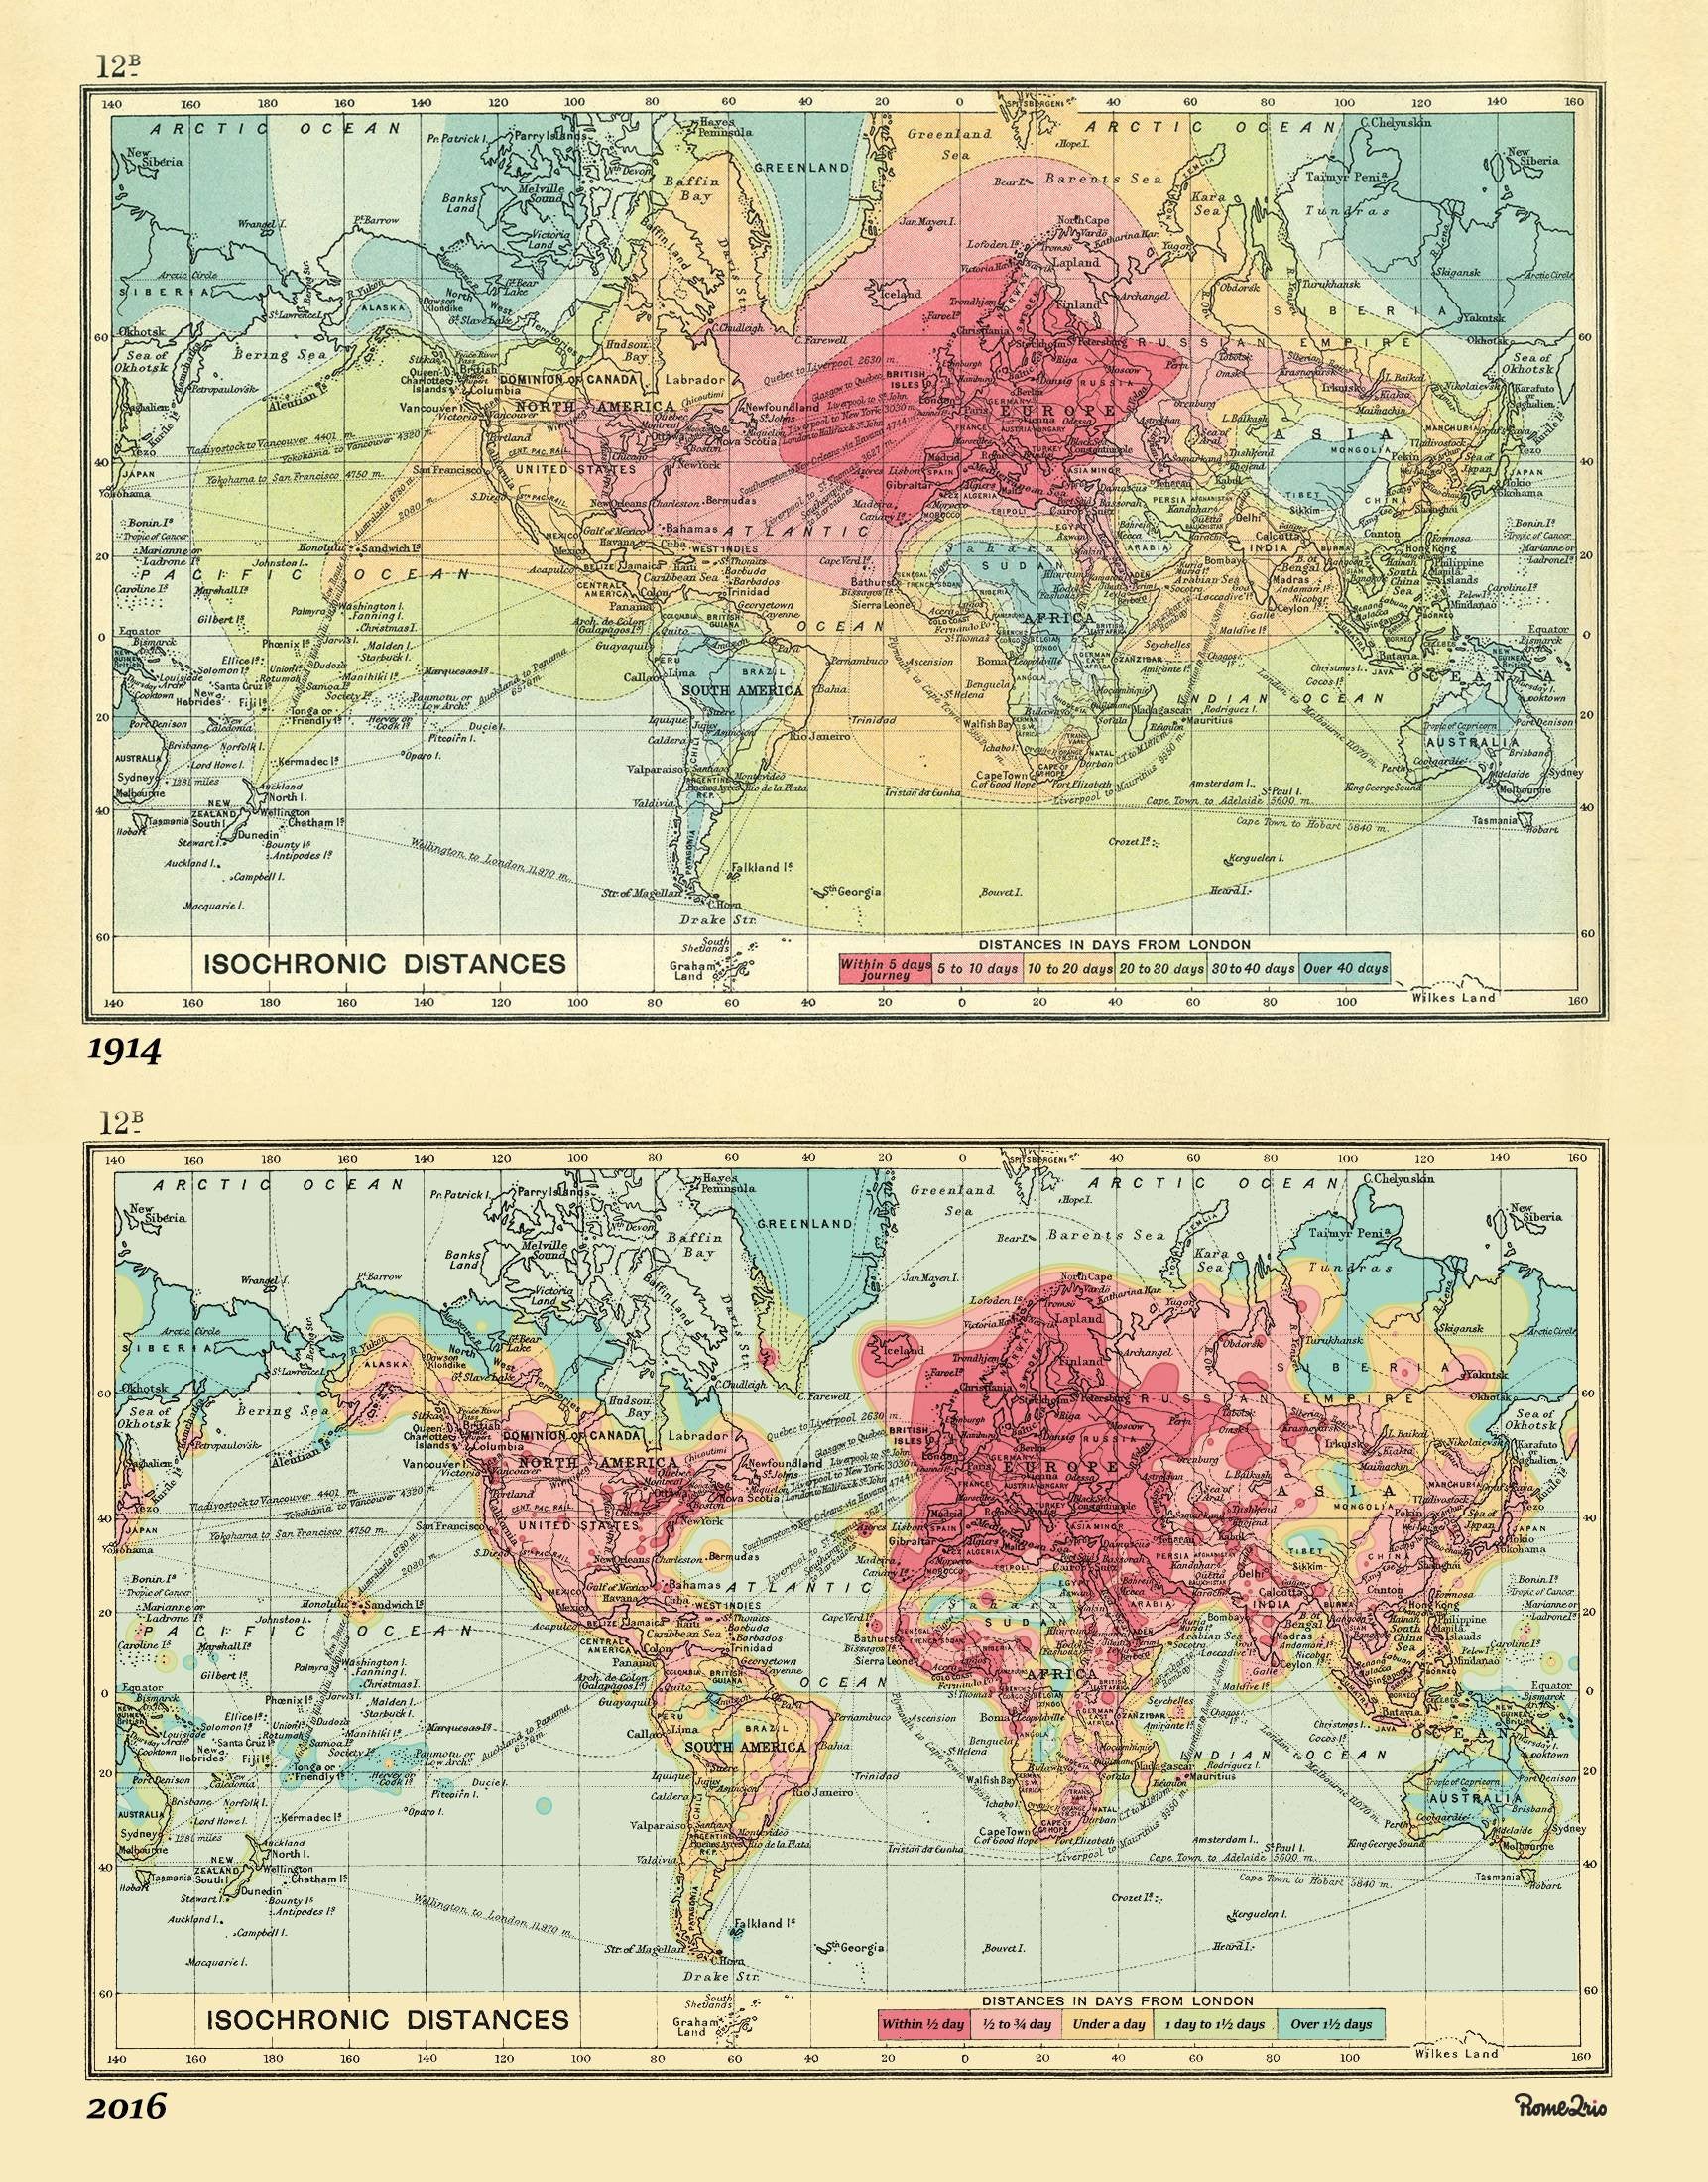
Or Rome2rio’s modern-day heatmap of the travel times from London to every airport around the world – which uses a map from 1914 as its base:
But what is it that makes a map click with its audience? Researchers and cartographers alike are trying to decode the mystery.
And while nobody has stumbled upon a fixed formula using which you would be able to craft viral maps intentionally, case study examples have shown that there are certain elements that can be associated with maps that are shared widely on social media or, depending on their content, via news organizations.
Elements of viral cartography
1. Simplicity
Like all good maps, viral maps are easy to understand. It shouldn’t take anyone more than a few second to get what the map is talking about – like the one below that shows you just how densely populated India is:
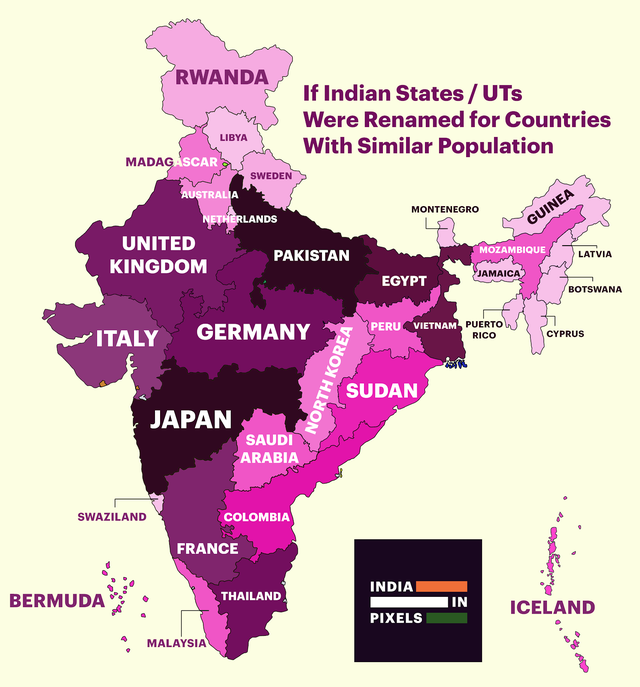
Courtesy: India in Pixels
2. Usefulness
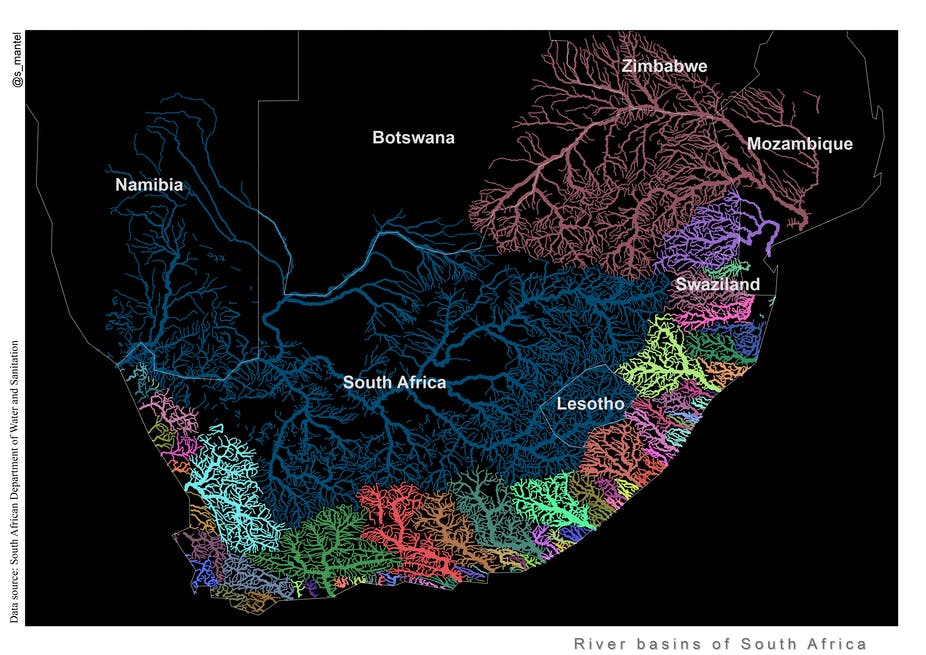
A map could also go viral if it answers a question of interest for a diverse group of people. When river ecologist Sukhmani Mantel decided to bathe the river basins of South Africa in the colorful palette below, she didn’t know it was going to go viral. But South Africans told her how they wished they had access to this map when they were in school. And you have to admit, maps like this would have made geography even more fun for all of us!
3. Aesthetics
Aesthetics also plays a very important role in making a map appeal to the masses. Let’s take the topographic map of Iceland below as an example. When you think about Iceland, you think icy whites or cold blues – not the deep reds that show the lowest elevations or the bright yellows that show the highest!
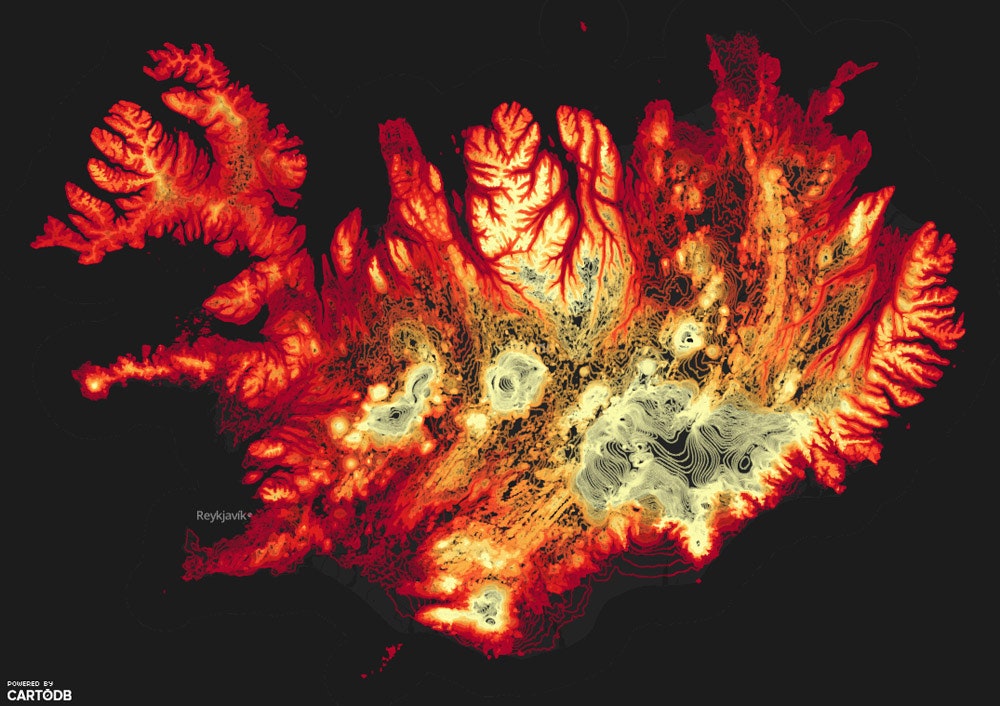
Courtesy: Aitor Garcia Ray
4. Emotional resonance
It doesn’t matter if its awe, or surprise, or joy, or fear, or anger – if a map is able to elicit an emotional response from you, chances are, you would want to share it with your friends or colleagues. Like the map below that divides Russia according to which country is the nearest to any particular point within the country, as the crow flies.
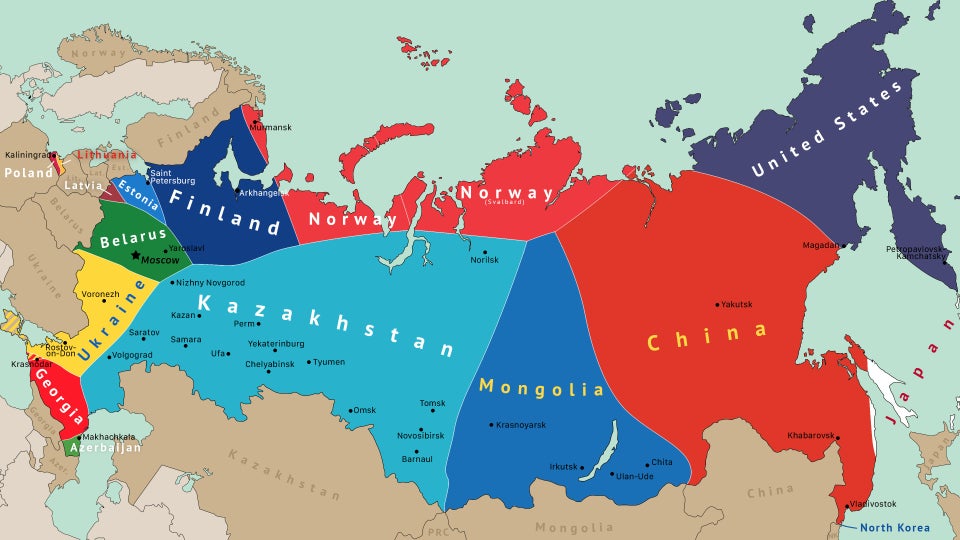
Courtesy: galacticpasta
You only have to go to Reddit to see some of the responses to this map to understand the importance of emotional resonance. Like this Norwegian guy who just found out that there is only one country that separates Norway from North Korea!
5. Humor
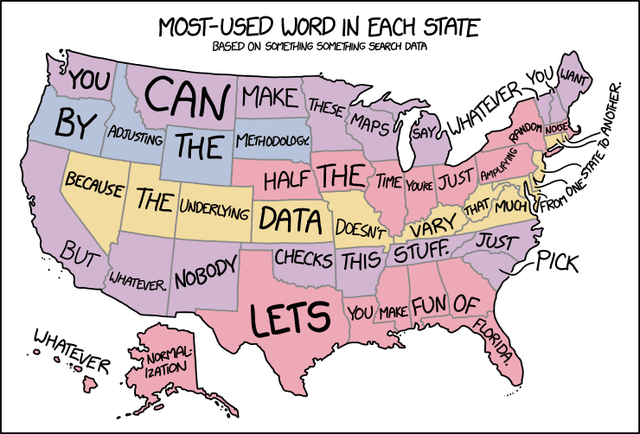
Courtesy: xkcd
The map above is a pointed critique that many maps that get shared on social media are just fluff rather than substance. But a little lightheartedness goes a long way to exorcise stress and connect us to each other – especially in these challenging times.
6. Topicality
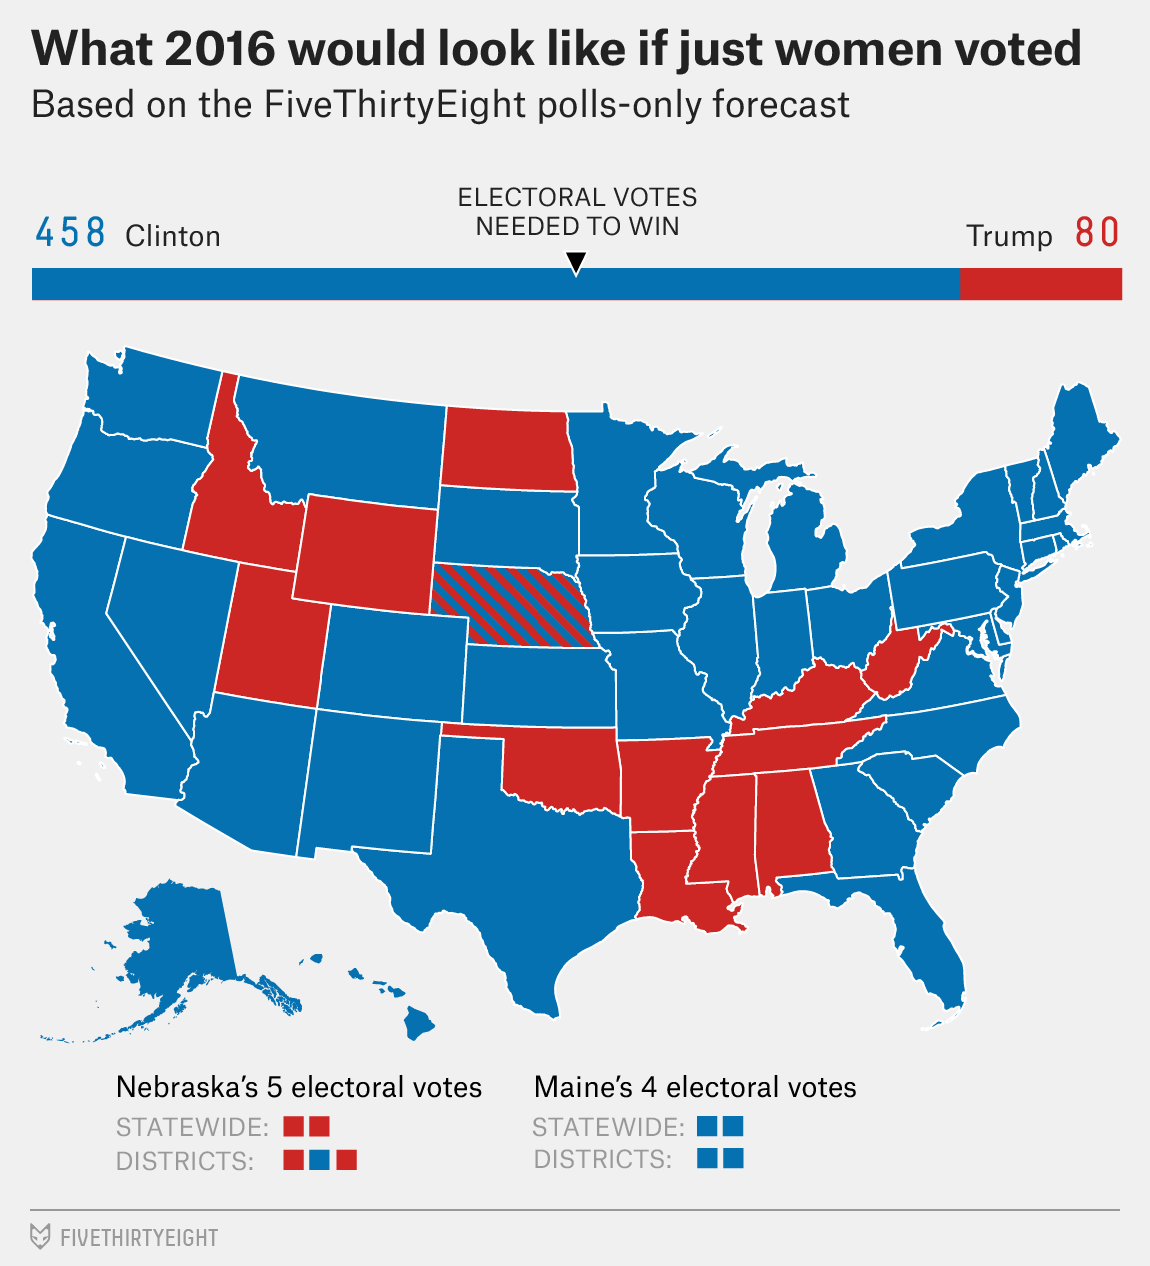
Timing, of course, can also play a crucial role in making a map viral. Nate Silver’s map below was released by statistical news website FiveThirtyEight just as the 2016 US presidential elections were heating up. It’s a projection map that gives you a view into a potential future – “if only women voted”. Not only has this map been viewed and shared millions of times on social media, but it also checks the box for the argument that imitation is the sincerest form of flattery.
Viral maps and fake news
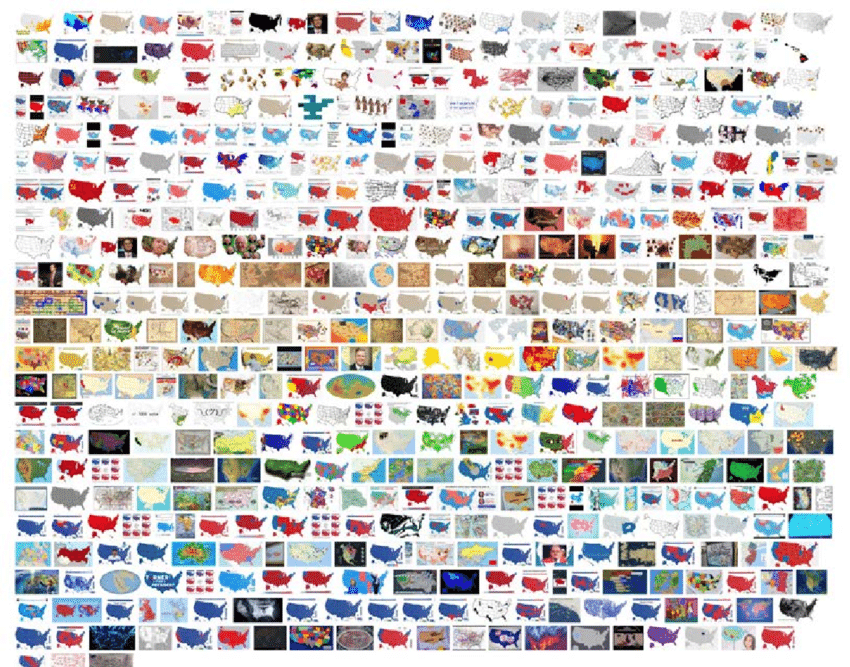
While researching viral cartography, Penn State geographer Anthony Robinson found that the above map had spawned a series of copycat maps, many of which also went viral. These included both the serious (what “if only people of color voted”) and the silly (“if only goats voted”).
Robinson found more than 500 such unique maps on the internet. And in the context of our battle with fake news, this is a very dangerous thing. When a map conveys more validity than it deserves, it becomes very easy to fabricate the truth; we all know how convincing auto-generated videos called “deep fakes” seem.
As Robinson says, “It’s cool that anybody can make a map now. They can take election data and do something creative with it, and it can be very helpful. But it’s also easy to make something that looks like it’s authoritative and use it as a weapon.”
The copycat maps
We must move beyond the notion that maps only show what’s “already there”. Maps can help to “create” perceptions and shape people’s “future actions” as well.
This is why it is more important now than ever to understand where a map has originated. In an ideal world, people would question map accuracy or introspect the intentions behind the map. In our world, technology will hopefully make up for the lack of skepticism among people soon. Machine learning image detection algorithms, like those from Google Cloud Vision, can be used to trace the provenance of viral maps and see how they spread online.
But until that happens, it’s our job to ensure that we and those around us, map responsibly and not just create anything for the sake of virality.
Watch this as a video story:

#Featured

Next article
The UN Biodiversity Lab – a partnership between the United Nations Development Program (UNDP) and the UN Environment – is an initiative that provides high-quality geospatial data to government representatives of more than 140 countries. The platform offers more than 100 global spatial datasets on biodiversity, protected areas, sustainable development, and human pressure using MapX open-source cloud solution.

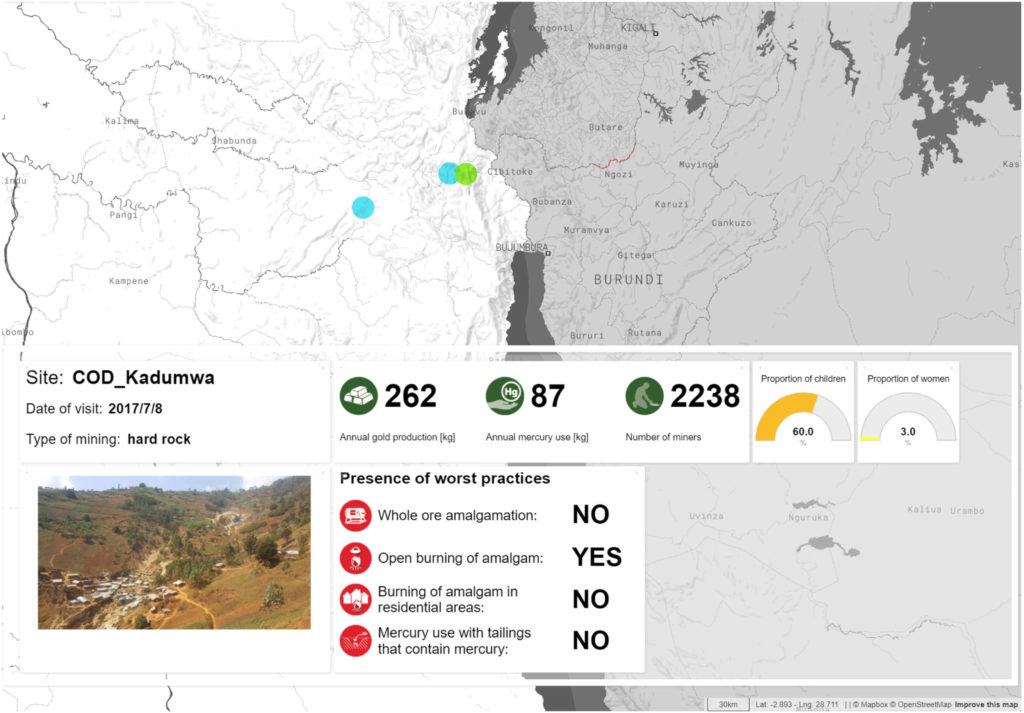
Example of MapX story map with narrative, picture and dynamic map, aiming at improving the understanding of a fieldwork assessment of the consequences of mining actions driving mercury pollution of sediments and water in DRC
What MapX does is that it acts as a bridge between data providers and data users. The mapping dashboard collates spatial data from the UN Environment World Conservation Monitoring Centre, the Global Resource Information Database (GRID-Geneva), NASA, UN agencies, and premier research institutions to ensure that governments across the world have access to the data they need to make key conservation and development decisions.
It should be noted that MapX is the only UN-backed geospatial mapping software that collects and verifies scientific data, brokers knowledge exchange for people in need of spatial solutions to environmental and natural resource challenges, and offers a customizable toolkit for analysis, visualization, and sharing. And it seems to be working.
A June 2019 analysis of 77 ‘Sixth National Reports’ submitted to the UN Biodiversity Convention has revealed that the number of maps in the 6NR reports has doubled and that 30 percent of the participating countries have used UN Biodiversity Lab to produce at least one of their maps.
In Bhutan, for example, MapX helped to bring the hydropower energy and the conservation sector together. With map visualizations laying bare the potential impacts on the ecosystem, planned hydropower projects were downsized and alternatives explored – one of which is to reallocate part of the hydropower energy revenues to targeted upstream land use management programs and ensure regular and reliable water flow and deliver benefits to local communities.
In the Philippines, MapX has allowed policymakers to explore proposed land reclamation projects in Manila Bay as well as the ecosystems that may be lost as a result. Eventually, a moratorium on land reclamation was put out, with arguments from the geospatial analysis.
Meanwhile, Tanzania has been able to ‘nature-proof’ agricultural development when spatial analysis showed that drip irrigation could improve resilience as well as overall food security.
You can explore all these examples and more in this MapX story map.