
The COVID-19 pandemic may be putting businesses through a great deal of uncertainty, but it is not stopping Intel from pursuing its dreams of global adoption of autonomous transportation. The technology giant is scooping up transit data powerhouse Moovit for approximately $900 million. The mobility-as-a-service (MaaS) solutions company will join Intel’s driverless automotive division Mobileye. Intel had acquired Mobileye for $15.3 billion in 2017.
Moovit, an Israeli startup, is known for its urban mobility application that offers travelers around the world multimodal trip planning by combining public transportation, bicycle and scooter services, ride-hailing, and car-sharing.
Also see: After Google Maps, now Moovit is offering AR-based navigation
Intel sees mobility services, including robotaxi services, as a $160 billion opportunity by 2030, and believes that Moovit’s tech stack will help to bring the company closer to its goal of becoming a complete mobility provider.
According to Intel CEO Bob Swan, “Intel’s purpose is to create world-changing technology that enriches the lives of every person on Earth, and our Mobileye team delivers on that purpose every day. Mobileye’s ADAS technology is already improving the safety of millions of cars on the road, and Moovit accelerates their ability to truly revolutionize transportation – reducing congestion and saving lives – as a full-stack mobility provider.”
Insisting that mobility is a basic human right, Nir Erez, Co-founder and CEO of Moovit, says, “The combination of Moovit’s leading urban mobility app used by millions, our deep understanding of people’s mobility usage patterns and needs, together with Mobileye’s world-leading self-driving vehicle technology, will create revolutionary transportation alternatives.”
In addition to his role as Moovit CEO, Erez will also serve as an Executive Vice President at Mobileye and a VP at Intel Corp.
What’s in it for Moovit users?
Moovit users are expected to have access to a wider range of mobility alternatives, including multi-modal routes that combine public transit, bikes, scooters, shared-cars, rider-hailing, and (ultimately) Mobileye’s fleets of self-driving vehicles.
Erez adds that Moovit will also offer cities better urban mobility insights, powered by Big Data and artificial intelligence, to help them better understand their citizens’ mobility needs, and match them, in real-time, with the best mobility options.

#Business


Next article
 The outbreak of COVID-19 has a profound impact on our mobility. For the past weeks, most of us stayed home, which is not only driven by travel and gathering restrictions but mainly by our responsible behaviour trying to “flatten the curve”. How long will we be forced to stay home? Some experts say a few weeks, other a few months… Regardless of that, changes in our mobility model will stay with us for a long time to come.
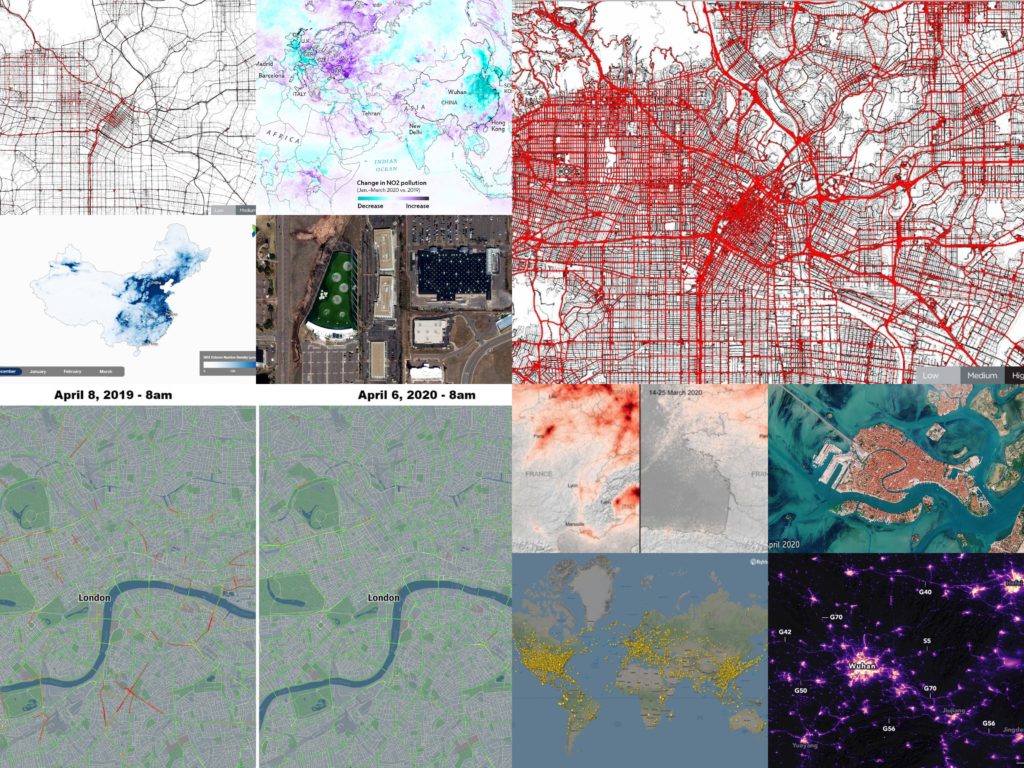
The impact of the lockdown on our mobility can be of course measured using various geographic data sources. Below you will find examples of some of the ways organizations across the globe use to measure it.
Road Traffic
Both TomTom, and HERE measured the impact of the pandemic looking at traffic data. TomTom compared typical Monday traffic from January, 24th and April, 6th 2020 in cities around the world and concluded that the traffic volumes dropped typically by 65-85%, which practically means no traffic congestion at all.
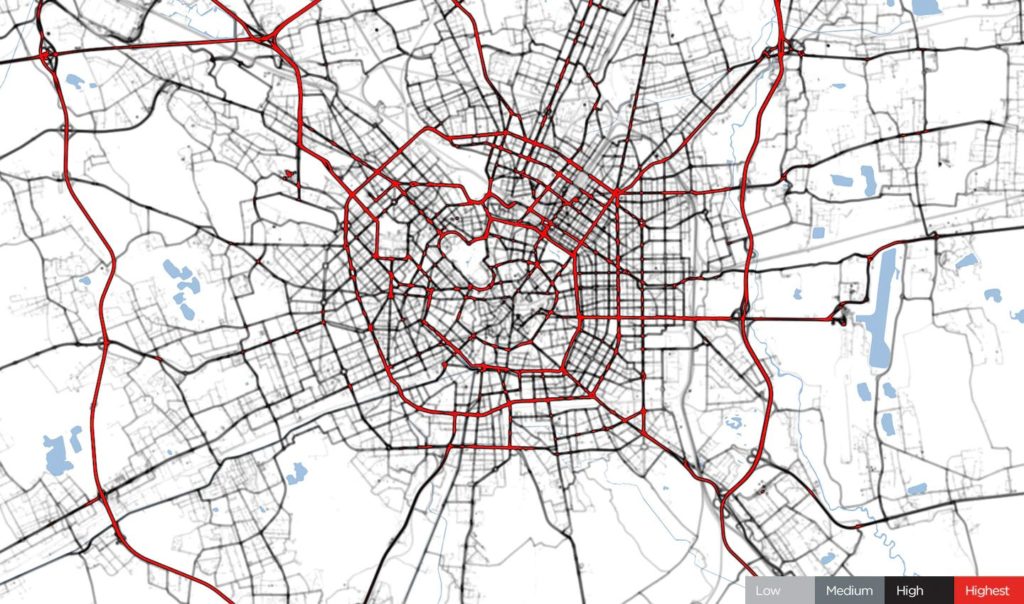
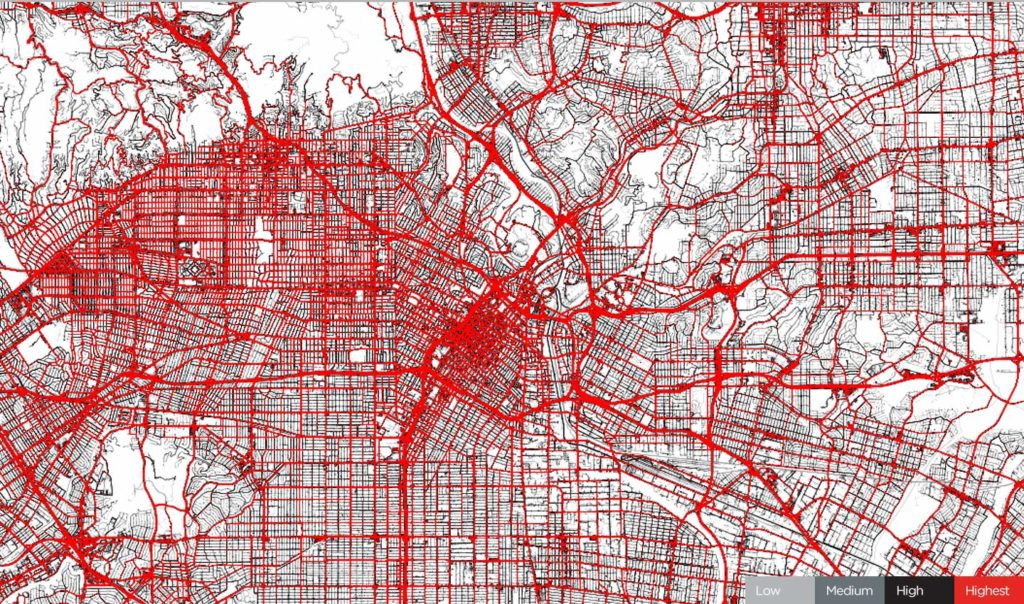
Milan, January 24, 2020. Before COVID-19 restrictions, source: TomTom
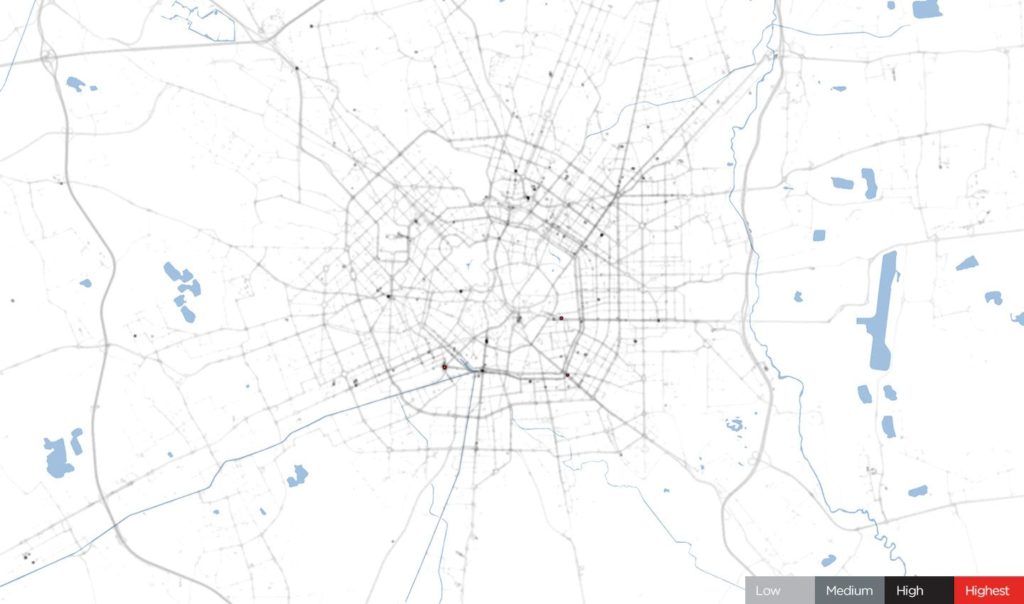
Milan, April 6, 2020. During COVID-19 restrictions, source: TomTom
Los Angeles, January 24, 2020. Before COVID-19 restrictions. Source: TomTom
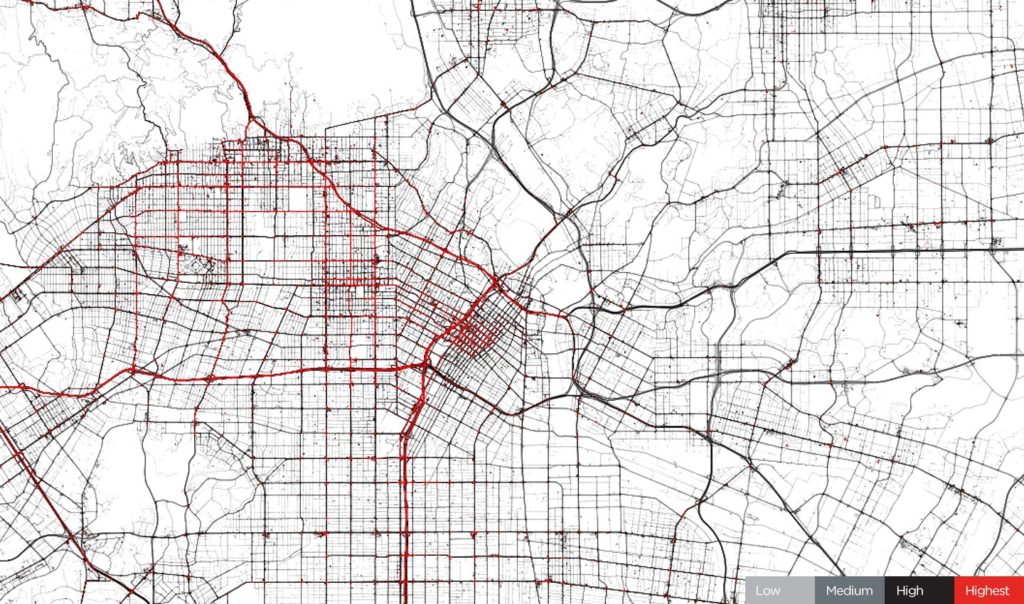
Los Angeles, April 6, 2020. During COVID-19 restrictions. Source: TomTom
HERE analysis compared peak time travel at 8 am on April 8th, 2019 and at the same time and roads on April 6th, 2020. Using this methodology the drop in traffic in major European capitals reached over 96%.
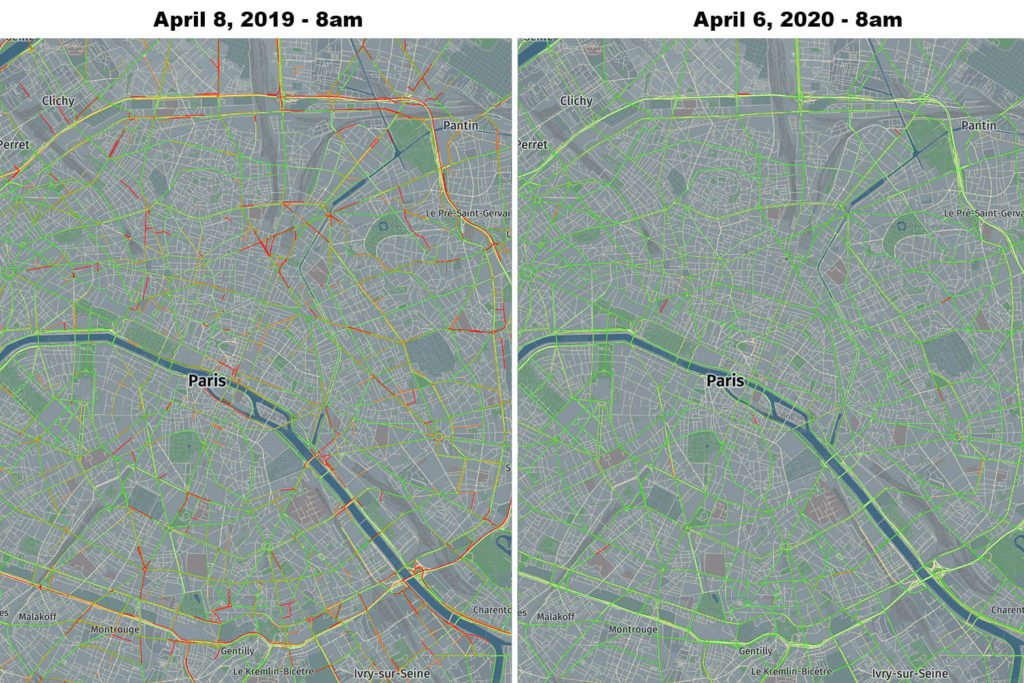
Paris – 96.8% reduction in traffic, source: HERE
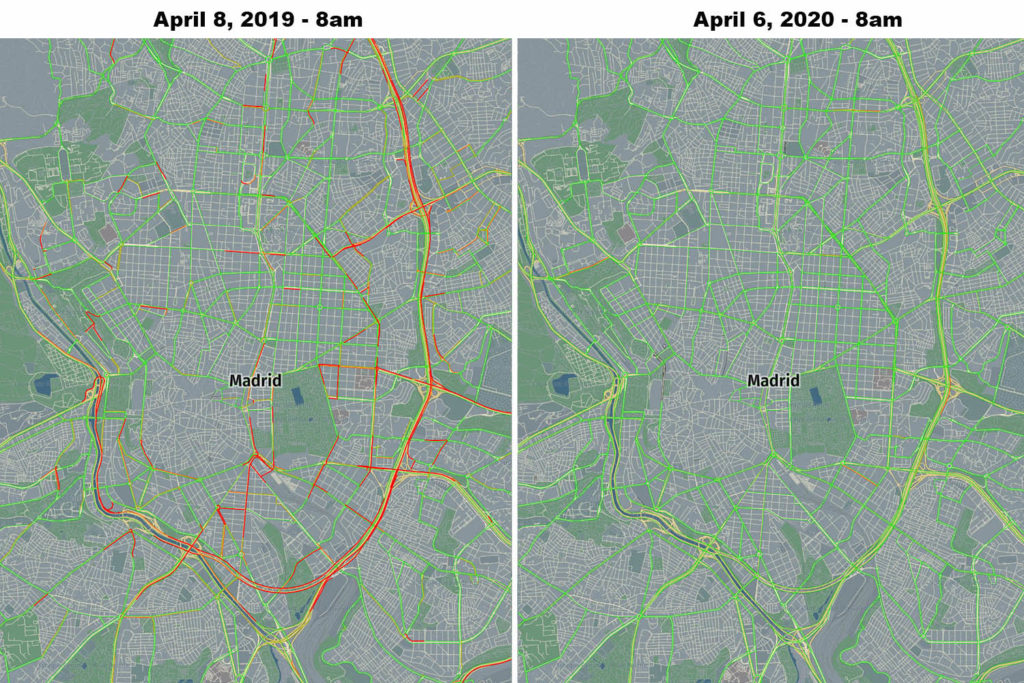
Madrid – 96% reduction in traffic, source: HERE
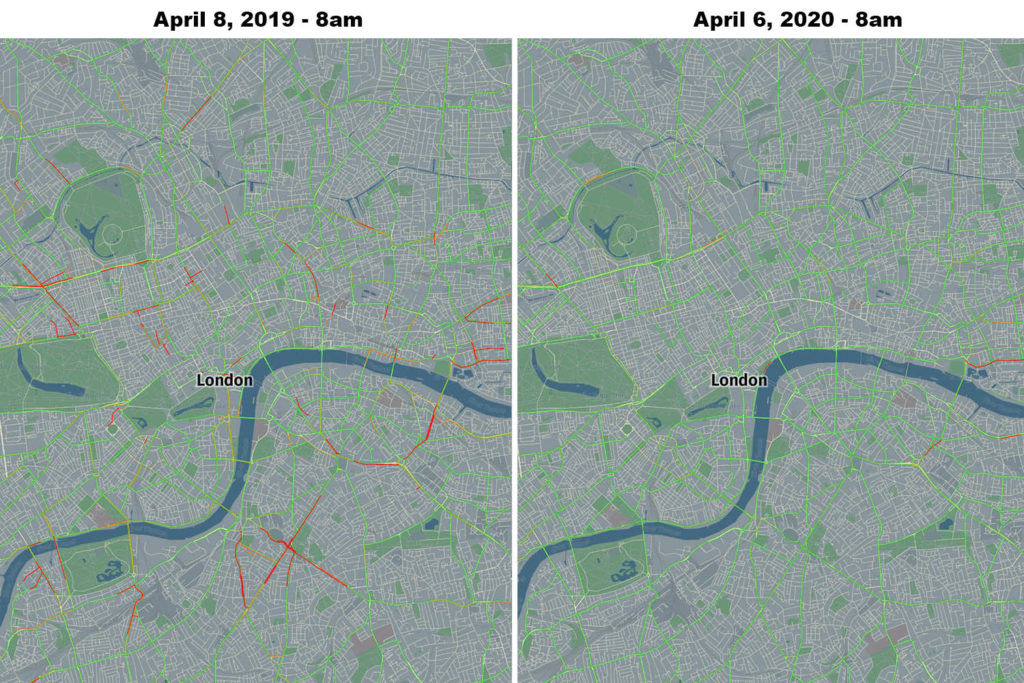
London – 90.2% reduction in traffic, source: HERE
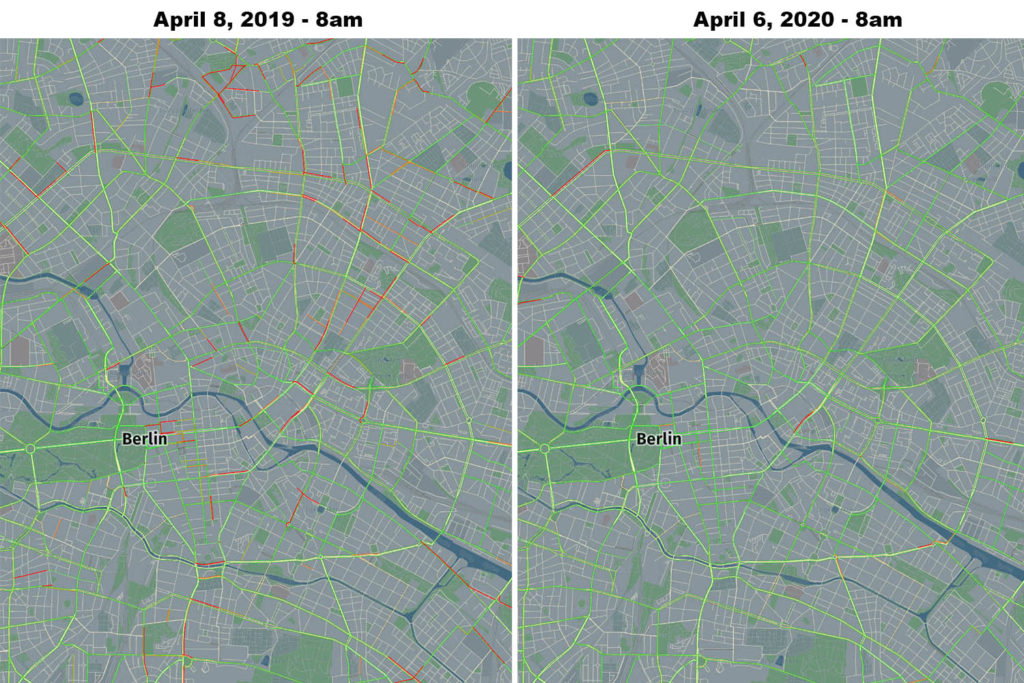
Berlin – 72.2% reduction in traffic, source: HERE
Air traffic
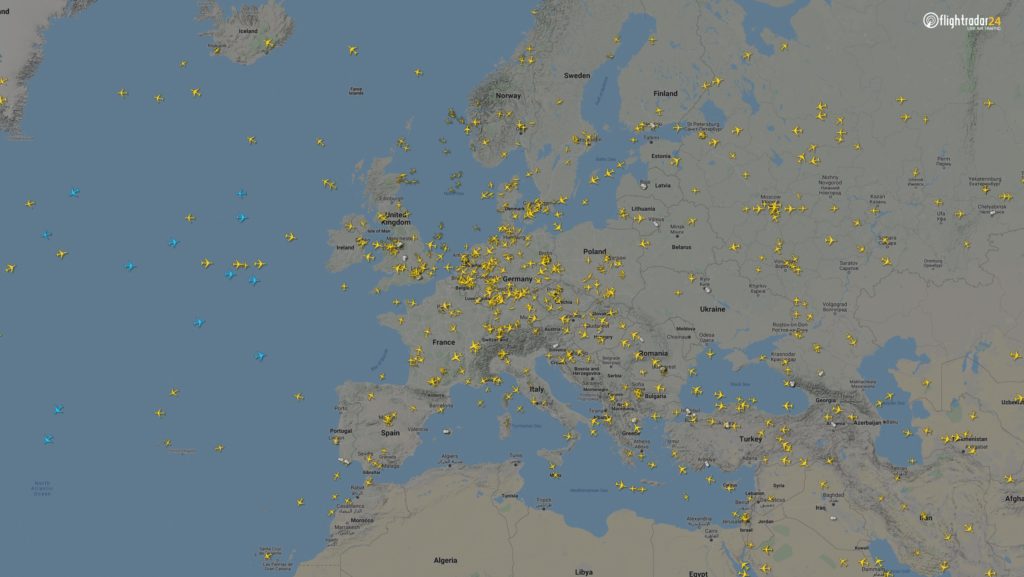
Air travel is another mobility domain of our life affected by the pandemic. Flightradar24 published a series of maps and charts showing a drop of air activity around the world.
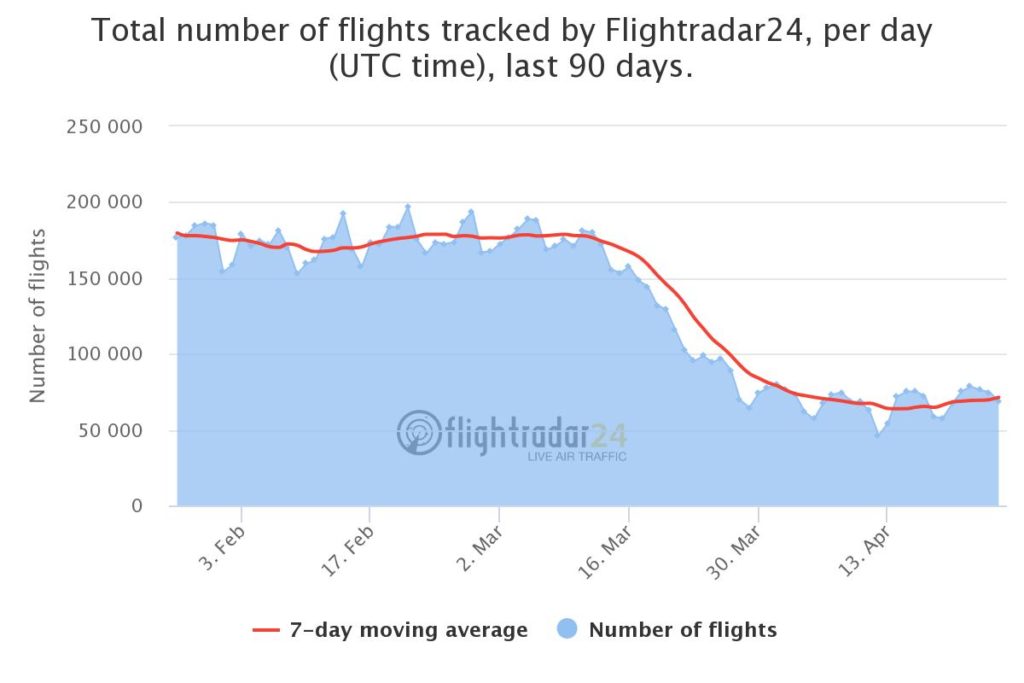
Majority of commercial passenger flights has been stopped, leaving mainly cargo and non-commercial aviation in the air. The portal created a snapshot of all flights in the air at 15:00 UTC on March 7 and April 7 2020. The number of flights at that moment in time dropped globally from 15,012 flights to 5,275.
15,012 flight in the air, 7 March at 15:00 UTC
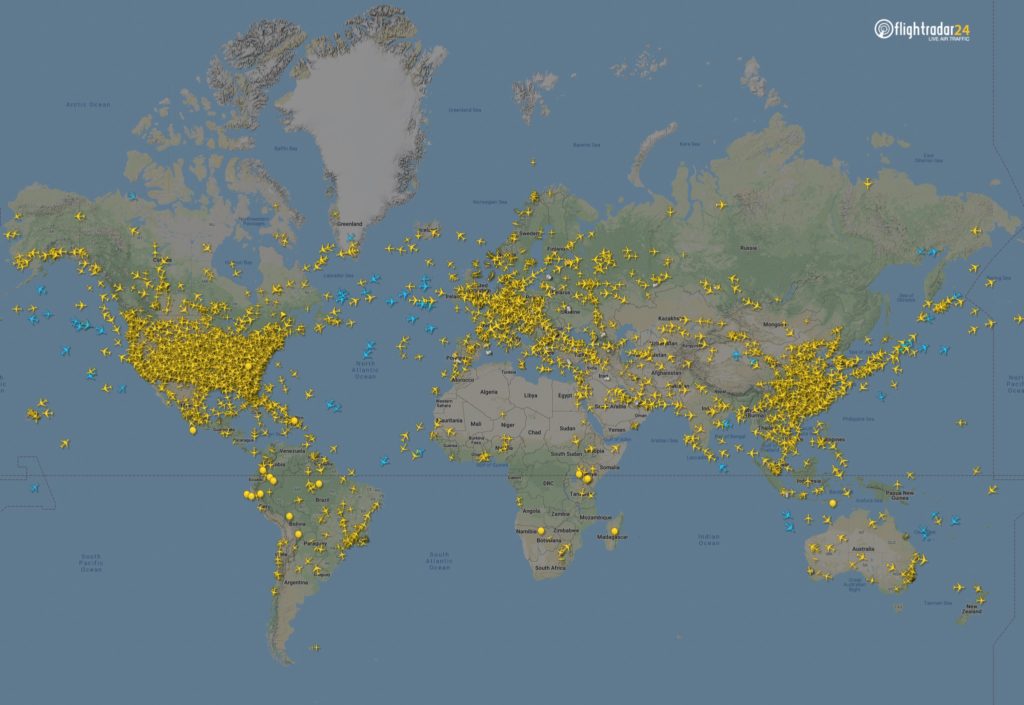
5,275 flight in the air, 7 April at 15:00 UTC
Flights in North America have declined considerably. The image from 18:00 UTC on 7 March shows 8,400 flights, while the 7 April displays just 2,950 flights.
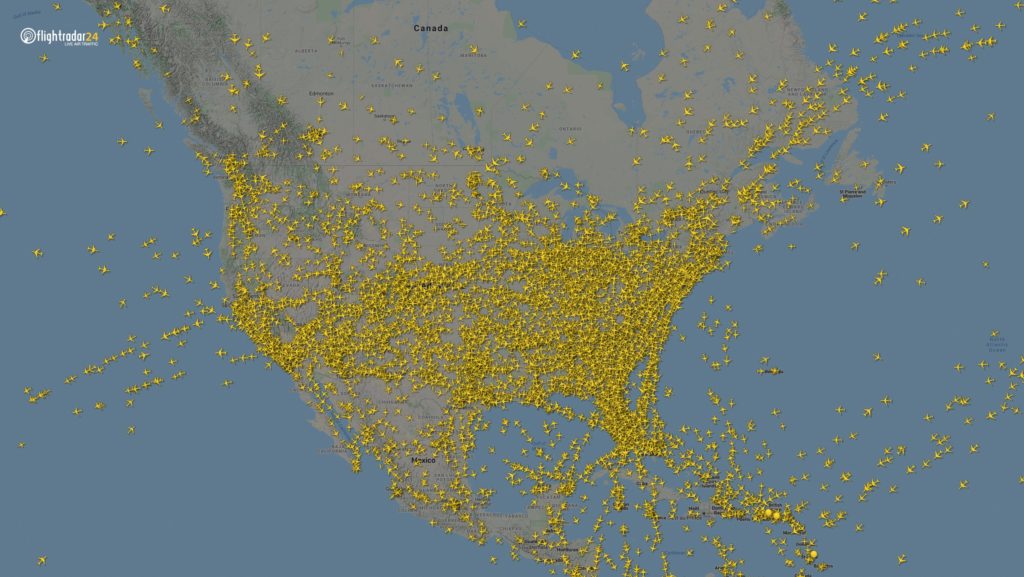
8,400 flight in the air, 7 March at 18:00 UTC
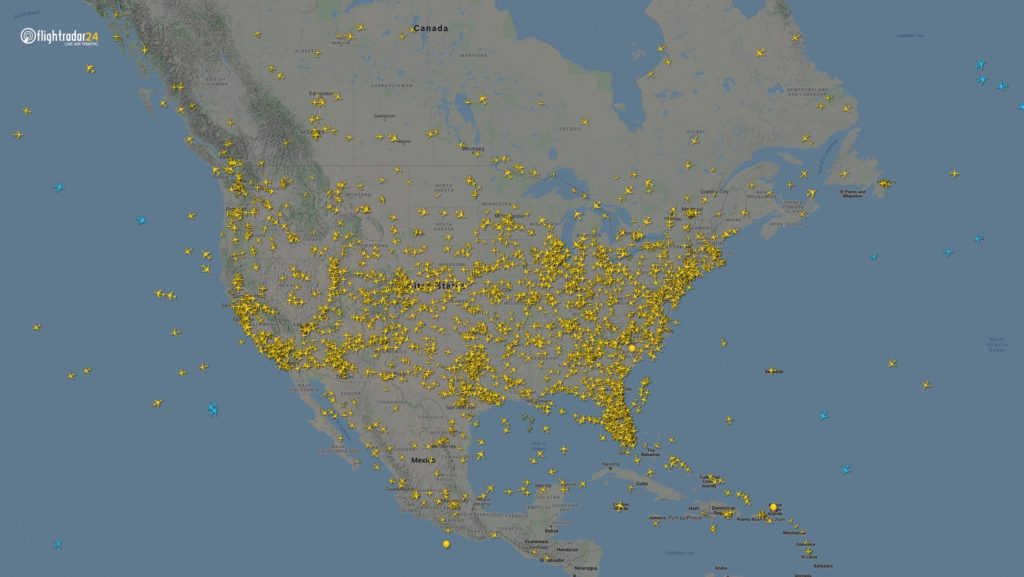
2,950 flight in the air, 7 April at 18:00 UTC
European skies have also quieted significantly. The difference between the March and April images below is a decrease of 2,400 flights.
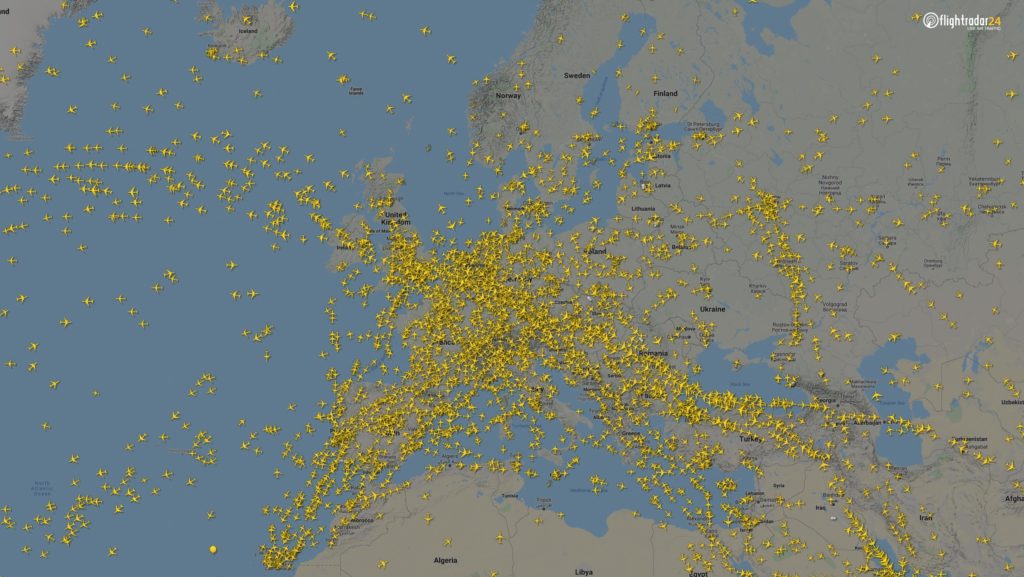
7 March at 15:00 UTC
7 April at 15:00 UTC
Air pollution
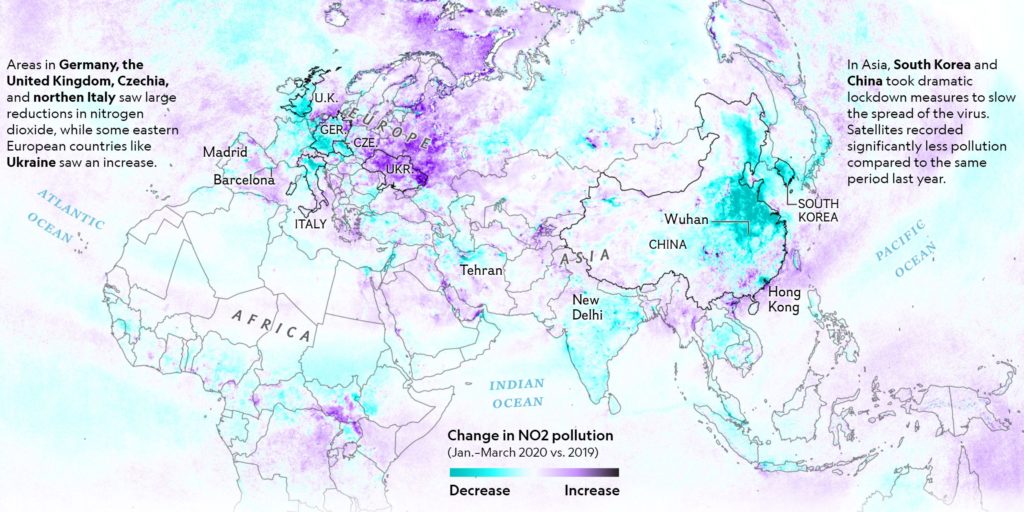
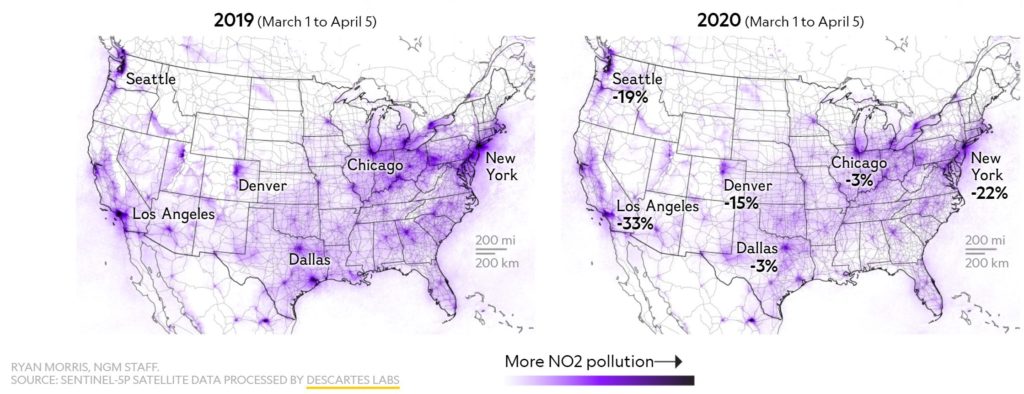
Another way to measure a drop in our industry and transportation patterns is related to measuring air pollution. European Copernicus Sentinel-5P satellite mapped a significant drop in nitrogen dioxide concentrations air pollution across the continent.
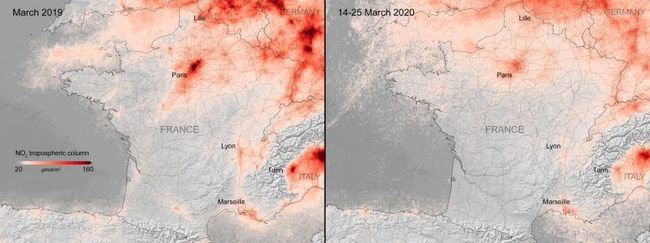
National Geographic created an extensive analysis and mapping of the NO2 pollution drop across the world
Another interesting analysis has been created by the European Environmental Bureau showing the impact of the January-February lockdown in China.
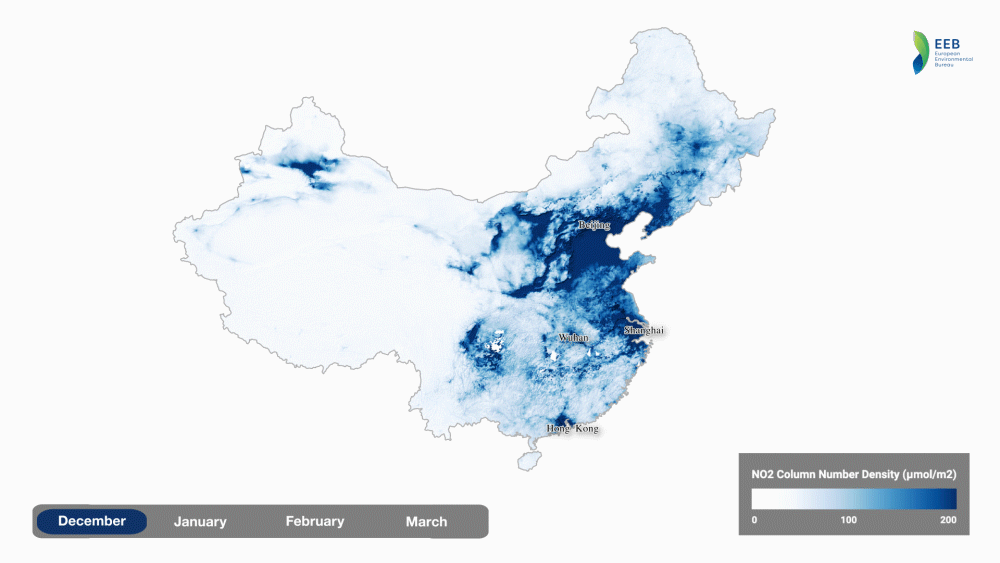
source: European Environmental Bureau
Interestingly, according to calculations done by Marshall Burke, an Earth system scientist at Stanford University, in China, the drop in pollution resulting from coronavirus shutdown is likely to save between 53,000 and 77,000 lives so much more than killed by the virus itself.
Satellite images
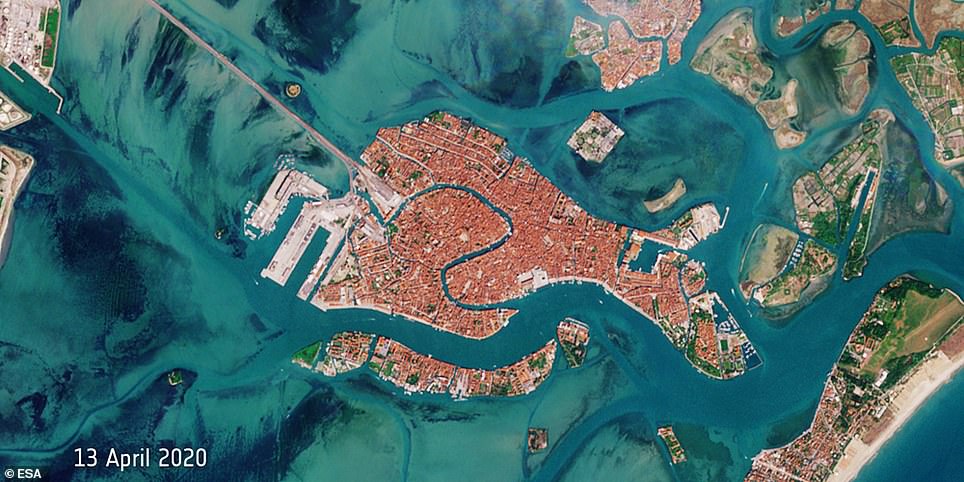
Another source of geospatial intelligence that indicates the mobility drop are satellite imagery. The Venice channels typical full of maritime activity are now nearly fully empty.
![]()
With sports clubs and shopping malls closed, we see a significant drop in human activity around these places.
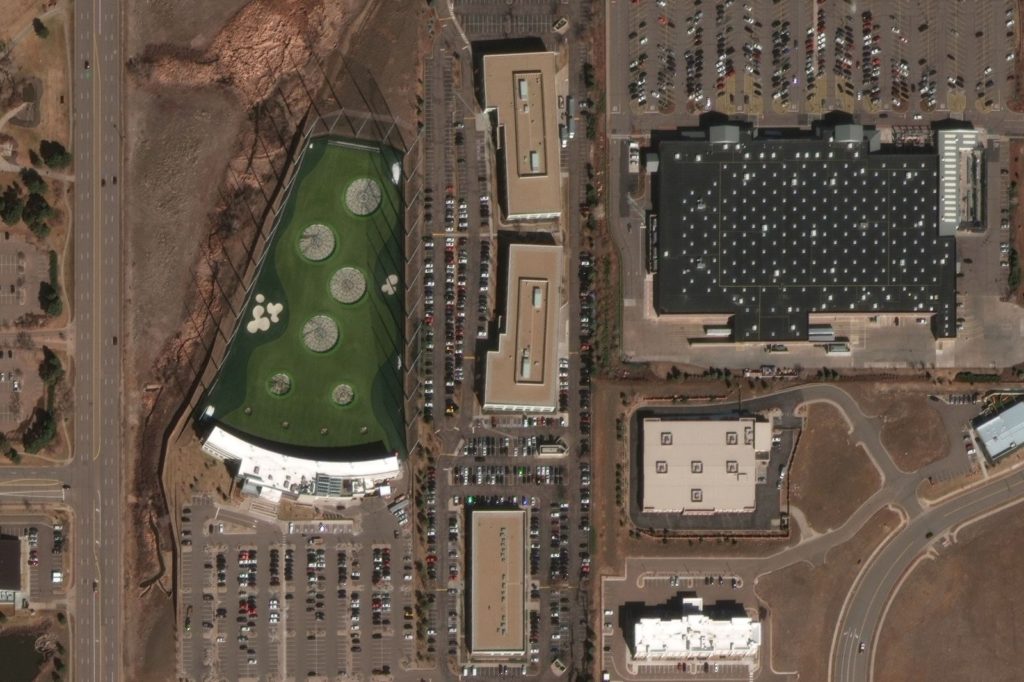
Top Golf and Walmart in Colorado, before Covid-19 Restriction on March 10, 2020
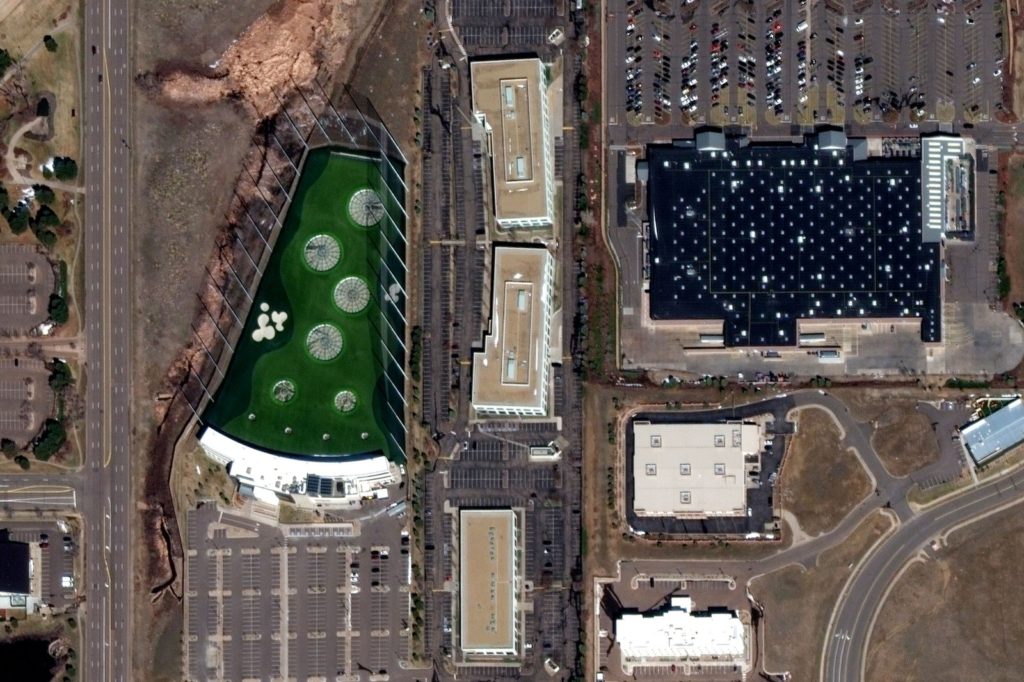
Top Golf and Walmart in Colorado, after Covid-19 Restriction on March 24, 2020
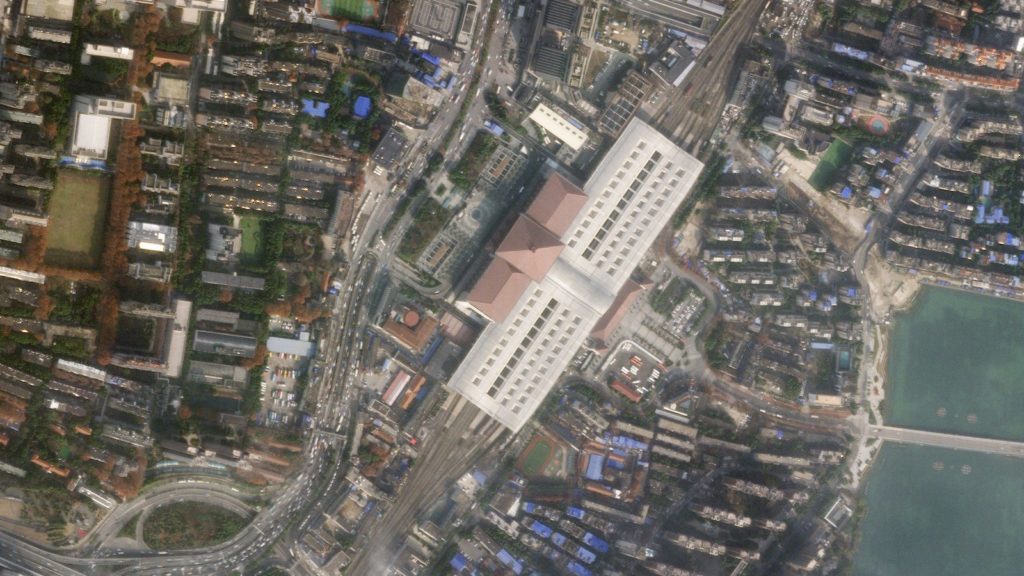
Train Station Wuhan, China before Covid-19 lockdown
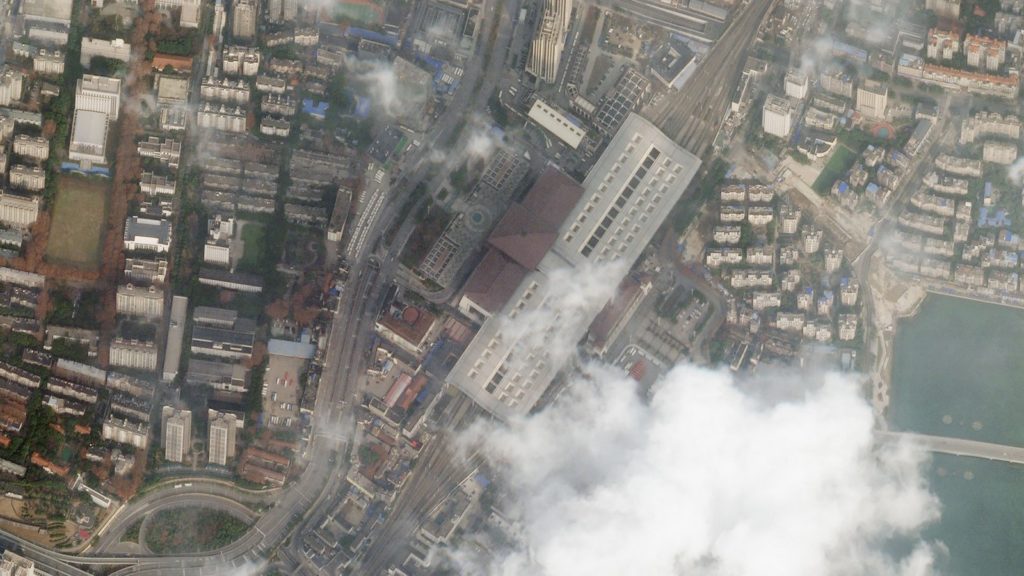
Train Station Wuhan, China after Covid-19 lockdown
Night lights
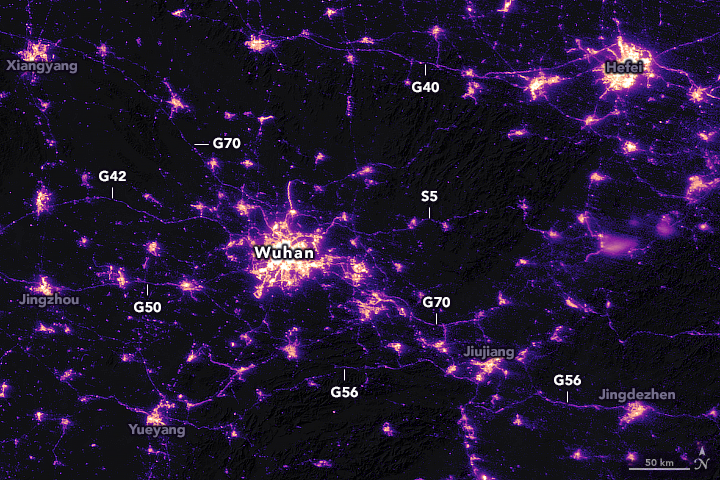
Another interesting indicator that can be measured using geospatial data is light pollution. As China came to terms with the gravity of the COVID-19 pandemic outbreak with the dawn of the New Year, the government suspended air, road, and rail travel in the Hubei province and placed restrictions on other activities in the region in late January 2020. This pronounced change in human activity reflects clearly in the nighttime images captured by NASA’s satellites around the city of Wuhan, China, between January 19 and February 4, 2020.
Wuhan, China, January 19, 2020

Wuhan, China, February 4, 2020
Stay safe!