
TomTom and Uber are joining forces to ensure our digital maps mirror real-road conditions. Uber has joined TomTom’s Map Editing Partnership (MEP) – a program wherein TomTom opens up its map-making process to trusted partners, allowing them to provide fresh, accurate location information that would help keep the maps up to date.
With the Uber app being used across more than 10,000 cities around the world, the ride-hailing and delivery company is uniquely placed to offer TomTom the latest on-the-ground insights from completed trips and deliveries – including observations about new roads, turn restrictions, street closures, etc.
In return, Uber will get to integrate TomTom’s more accurate than ever maps, traffic data, and Maps APIs across its global platform to provide a seamless experience to users. This will be an extension of the existing partnership between TomTom and Uber that began in 2015.
But what about map quality?
TomTom’s MEP trainers and subject matter experts teach trusted Uber drivers how to best edit a map. Once Uber’s editors gain certification through TomTom’s customized map editing curriculum, they are able to make changes to the live map.
At the same time, TomTom follows a stringent vetting process to ensure all changes are of high quality. All edits undergo the same quality checks that are required of TomTom editors. These real-time quality checks also give Uber editors a level of comfort when making edits and ensure the most accurate map possible.
Also, teaming up with Uber doesn’t mean that TomTom will stop collecting data from its existing sources – survey vehicles, government agencies, TomTom map users, vehicle sensors, and more. Even in the MEP program, TomTom plans to partner with more global leaders in the mobility, on-demand, logistics, and automotive industries.
TomTom regularly processes close to two billion map changes per month, and the MEP program is currently supporting an additional 3 million partner edits to the map every month in more than 70 countries.
“In these fast-changing times, having maps that reflect real-road conditions is more important than ever,” Shashi Vaijayanthi Rangarajan, VP Customer Program Management at TomTom, says. “That’s been especially true in recent months, as protests across the US blocked streets, flash floods washed out roads in southern Europe, and the coronavirus pandemic closed borders worldwide.”
Michael Weiss-Malik, Director of Product, Maps and GSS at Uber, concurs, “Our partnership will help create even more dynamic mapping experiences in our global marketplace.”

#Business


Next article


 Construction designs, mine designs, power line documentation—so much can be and is done in the Computer-Aided Design (CAD) environment. As a geospatial professional working in the drone data analytics industry for the past few years, it was easy for me to see the enormous potential of working at the intersection of CAD and drone data.
However, the challenge that I immediately came up against was that the CAD model does not cope well when trying to integrate drone-based photogrammetry data! Additionally, the CAD environment doesn’t facilitate data analytics in the way that the Geographic Information System (GIS) framework does. So, I decided that if I wanted to integrate and analyse drone photogrammetry data and CAD designs, the only way forward would be to translate the CAD data to a GIS data model.
Unfortunately, this appeared to be a far more difficult task than I had hoped! To explain what makes it so difficult to use the two models interchangeably, I’m going to use this article to summarise the key differences between the two systems.
In researching and writing this article, I came across a great episode of the Mapscaping podcast by Daniel O’Donohue, in which he talks to Dale Lutz, the co-founder and co-CEO of SafeSoftware (the company behind FME data transformation platform) about exactly this topic. I reference this episode several times in the article, but if you’re interested in the subject, I recommend you give it a listen:
Origins of CAD and GIS
To understand the fundamental difference between CAD and GIS, it’s worth going back to the origins of each system.
CAD has its beginnings in the construction design drawing process. For centuries, the design process was done using a pencil and paper, and then tracing paper. During the 1970s and 80s, the process started to be digitalized—first with The Intergraph Design System (IGDS) for PDP-11 (running on Unix), then MicroStation for PC, and eventually paving the way for AutoCAD in the early 1980s.
 The idea behind CAD was very straightforward: digitalizing the process of drawing construction designs. It was intended to expedite the process, not to revolutionise it, and so the aim was still to produce drawings that humans could read—significantly, as opposed to machines.
By contrast, GIS was developed expressly as an analytical—rather than a visual—tool to store and work with geographic data. One of its earliest uses was in rural Canada in the 1960s to assess current and potential land use, collating and analysing factors like wildlife, soil quality, agriculture and forestry. Crucial to this, is the facility to overlay multiple datasets on the same geographic reference point, and also to create true embedded topography.
CAD is an ideal environment for generating technical drawings, while GIS is a system which aims to structure the geographic information is a way that enables analytics. This fundamental difference in purpose and origins has consequences today. If you have ever been to the office cabins on a construction site, you will probably have noticed that although computers are, of course, widely used, the walls and desks are covered with physical paper copies of construction designs. On site, engineers do not have the time (or often the means) to sit at a desk, clicking on data points to learn about their attributes or change their colours. CAD is used as a tool to assist the design of an object or structure, and to produce a reference document that supports the construction process.
Data models
With this in mind, it is easy to see why the CAD data model tends to be unstructured—or at least, the structure is not enforced. Objects only have a limited number of attributes, and the ID of each object is often ‘floating’ and may change in each version of the file. As the model is made to provide information to the human eye, it’s often based on separate lines which are not digitally connected (on vertices into polylines or polygons), so there is no enforced topology of the whole structure. GIS, on the other hand, has a very strict structure. Dale Lutz gives a good explanation of this difference between the models:
Take a leader line that needs a label, but the label can’t quite fit where it’s supposed to go because it would be on top of things. You place the label on the side with a line that points to where it belongs. When you then try translating this in GIS, you need to go and slide the label along the leader line to figure out where it should be, and you derive the implied relationship. CAD geometry is more straightforward than GIS because things don’t have a relationship with anything else around them other than where they physically are.
CAD also enables the use of different types of geometry on a single data layer, and these data types are often not native in GIS—such as splines, arcs, circles, cones, and complex 3D objects. In GIS, there are two major data types: vector and raster. Vector data has three basic geometry types: points, lines and polygons (and some derivatives of these basic three types). The data has strict attribution requirements, and the metadata is also well defined. Here’s Dale again with a great analogy (especially considering GIS’ origins!):
GIS is more structured. A bit like Canadians. You know—law, order, and good government. It’s data management with precise specifications and schemas defined. It would be hard to go rogue and abuse it. CAD, on the other hand, can be a backdrop for a Wild West scenario. CAD technicians can apply their artistic license and suggest how it should be used and design anything they want. Nothing in the system will stop them. CAD is like Americans: You can’t tell them what they can’t do.
There has been an attempt to tackle this lack of enforced structure in CAD, using Building Information Modeling (BIM), which takes CAD drawings and attaches meaning to make explicit relationships between data points. This structure enforces topology, as well as enabling rich attribution, which is exactly what geospatial engineers were waiting for—but if you have ever tried to convert a complex BIM model as part of the workflow you will know that it’s still something of a nightmare!
Conversion and analytics
All these differences make it extremely difficult to translate between the two systems and creates a headache for organizations thinking about running geospatial analytics on top of CAD data (using LiDAR or photogrammetry data together with CAD drawings, for example). Most of the time the CAD data has to be translated to GIS before geospatial analytics can be run on it—a laborious task.
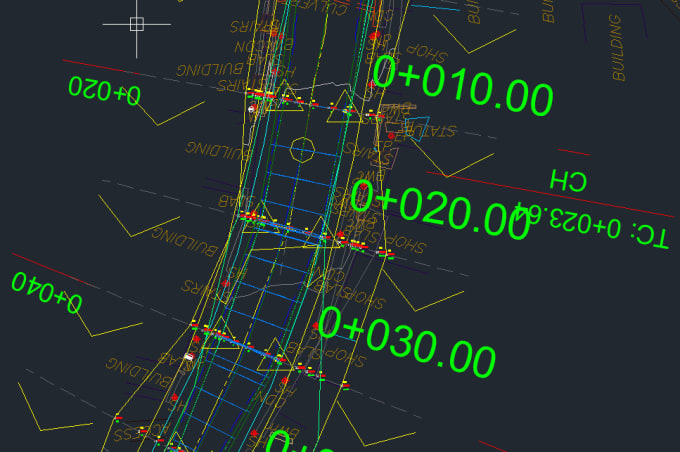
The first challenge is very often right at the beginning. CAD data is barely ever georeferenced, which necessitates manual (or semimanual) georeferencing. The next challenge is related to geometry types. CAD is likely to have many geometry types on a single layer, and migrating it to GIS will require splitting these into separate layers. This often results in four times as many layers than in the source CAD data—and bearing in mind that CAD designs of complex objects (such as a highway) might already have 600-700 layers, that’s a lot of layers! Additionally, objects such as text on a design might be mistakenly be converted to geometric shapes instead of characters.
On top of all this, we come back to perhaps the most fundamental problem, which is that CAD objects do not have enforced topology. This means that that neat polyline or polygon that looks great to the human engineer might be in fact be just a set of loose lines in data terms. To make this data practical and useful in a geospatial environment you very often need to apply dozes of rules to fix the geometry.
What can GIS and CAD learn from each other?
Can this gap between the systems be bridged? Although many geospatial engineers do not fully understand CAD, and CAD people do not fully understand GIS, there is a lot that these two can learn from each other. CAD can certainly be improved by incorporating some of GIS’ data structure and topology rules.
The situation is already improving, through the enforced structure in newer CAD modelling systems, as Dale points out here:
More recently, systems like Maximo and IBM require CAD standards as well as CAD files to conform. This opened up a new market for CAD add-on tools that enforce specifications, resulting in tighter data models. NewCAD now has certain GIS elements, a little bit like Bentley’s XFM that stores rich attribution with drawing elements such as AutoCAD map or Civil 3D, providing structure.
CAD, on the other hand, is more human. It has been used to make beautiful drawings for the last 40 years. Drawings that people can look at, instantly understand, and use to make quick decisions. Additionally, CAD is very efficient: A CAD command line allows advanced users to seemingly work magic with a few clicks of the mouse. GIS can learn a lot from this user-oriented approach.
Final word
Although there is a big push in terms of interoperability, and Esri has been cooperating with AutoDesk for a while now, there doesn’t seem to be a future where the two systems will talk to each other seamlessly. The philosophy behind both of them is so different, that there is almost no hope.
However, interoperability is still possible when some geometry rules are enforced onto CAD. For those, like me, who want to run geospatial analytics on top of CAD data, this is the key thing to bear in mind when embarking on the CAD creation process.