

As they push for a lower-carbon future, governments around the world are fueling the rapid expansion of renewables. And yet, if you wanted to see where the current solar or wind infrastructure is located, the lack of accessible information out there would leave you stumped. That changes now.
For the first time ever, researchers have mapped the global locations of major renewable energy sites, giving a clear indication of both the infrastructure density in different regions and approximate power output. Behold:
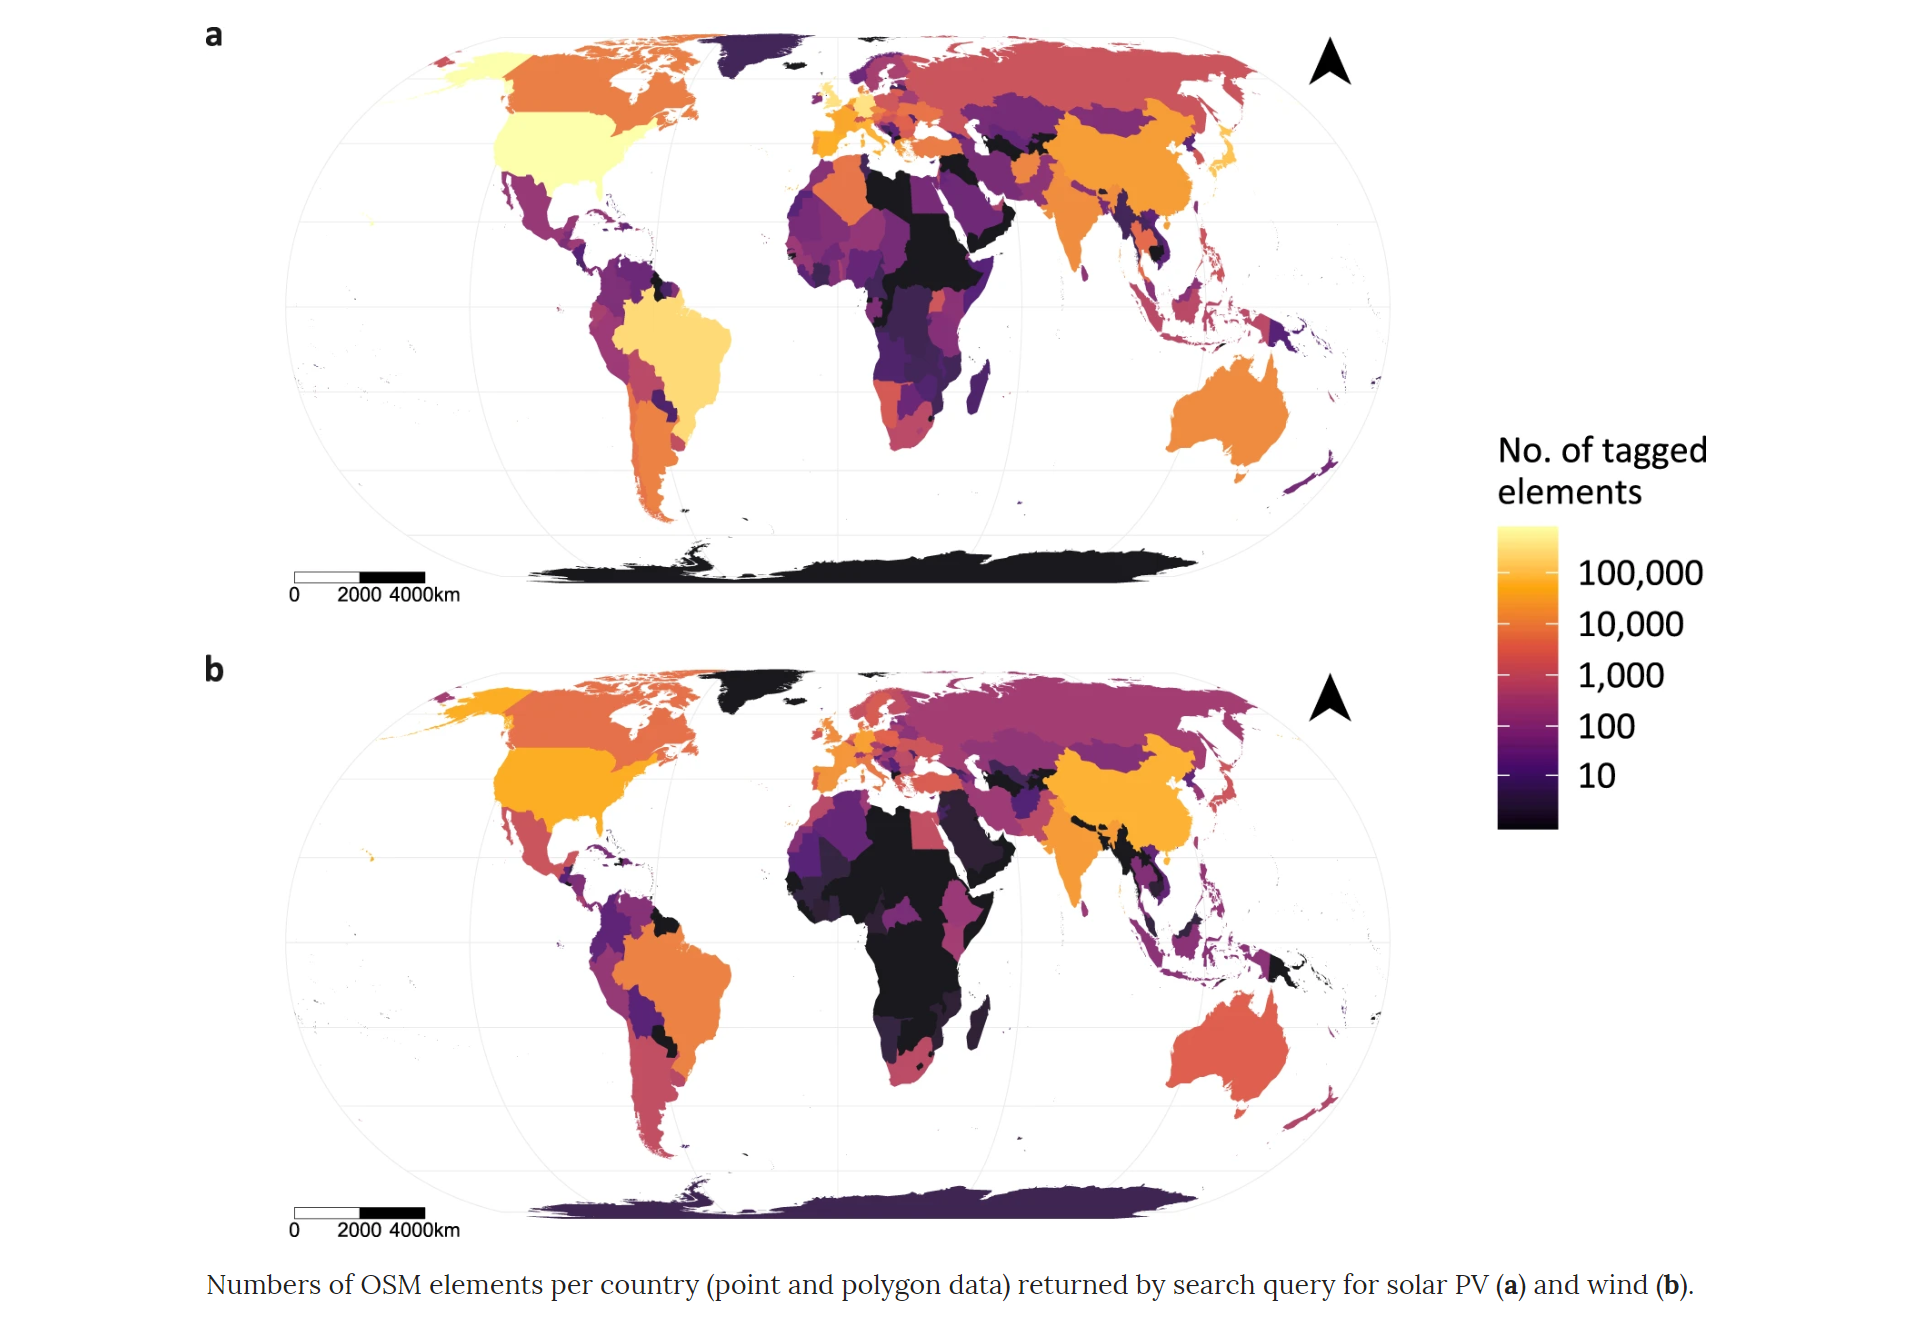
Courtesy: Nature journal Scientific Data
In a study, published in the Nature journal Scientific Data, University of Southampton researchers have showcased where the global green energy revolution is coming from. Using OpenStreetMap infrastructure data, the researchers have determined that Europe, North America, and East Asia are dominating the renewable energy scene. Their results correlate extremely well with official independent statistics of the renewable energy capacity of different countries.
By accurately mapping the development of renewable farms, the researchers not only wanted to create a global, open-access, harmonized spatial dataset of wind and solar installations, but they also hope to provide an insight into the footprint of renewable energy on vulnerable ecosystems and help planners assess such effects.
According to lead researcher Sebastian Dunnett, “While global land planners are promising more of the planet’s limited space to wind and solar energy, governments are struggling to maintain geospatial information on the rapid expansion of renewables. Most existing studies use land suitability and socioeconomic data to estimate the geographical spread of such technologies, but we hope our study will provide more robust publicly available data.”
The research data is available in vector format, either as geopackages, shapefiles, or comma-delimited and describe groupings of wind turbines or solar PV, i.e. energy ‘farms’, as well as lone installations, i.e. a single wind turbine or solar panel. The metadata, describing whether the location is urban or beside/on a water body, as well as an estimate of its power capacity (created using a predictive model) is also included. Access the complete study in Nature here.

#Featured


Next article
Australian university adds 5,000 rare, unique Asia-Pacific maps to online collection
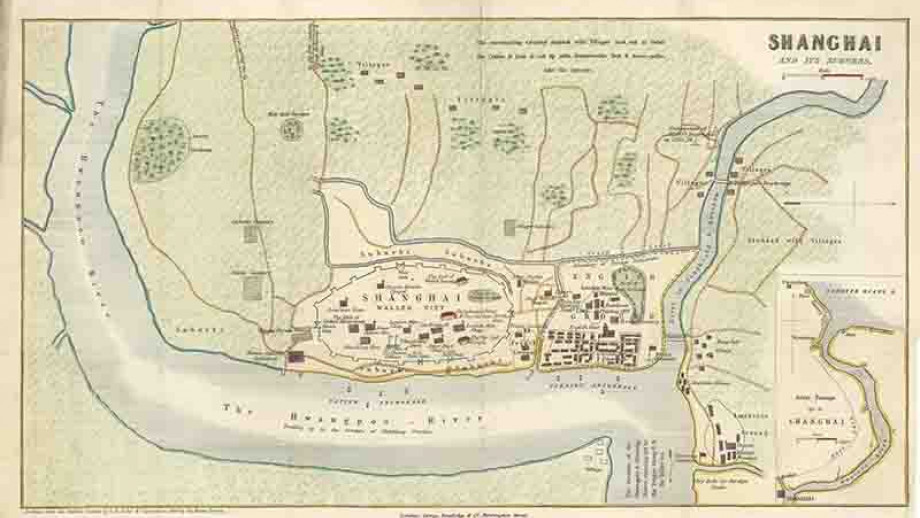
China, Shanghai, and its Suburbs, c.1853. Courtesy: ANU
The Australian National University has added scans of more than 5,000 rare and unique maps to its Open Research library. These maps have been added to the Asia-Pacific Map Collection which now contains more than 30,000 topographic, cadastral, aeronautical, bathymetric, thematic, and tourist maps of Asia, Australia, and the Pacific regions.
While several maps date back hundreds of years, the collection also boasts of some unique, one-of-a-kind pieces. Jenny Sheehan, who manages the collection, tells, “We have over 120 antique maps from the 17th, 18th and 19th centuries, 60 of which were generously donated to us… The earliest map dates back to 1662. It is a full map of Batavia – the old capital of the Dutch East Indies – with all its forts.”
The Asia-Pacific Map Collection is also home to the ‘Roti Map’ – a pre-1907, hand-drawn piece representing Dutch political structure and showing all the villages on the island. Interestingly, this map cannot be found in Indonesian or Dutch archives and is unique to Australian National University’s collection.
“The map is full of local knowledge and was locally produced,” Sheehan explains, underlining how the value of a map is the story it tells of that particular snapshot in time.
Another stand-out piece from the collection is a 76-year-old inclinometer – an instrument that was created in 1942 in Australia to aid the Allied military forces with surveying during World War II.
Sheehan also points to a booklet of 30 historic Papua New Guinean photos, a 19-inch Phillips terrestrial globe from 1945, and a rare map from 1896 depicting catholic missions across New Zealand, Tahiti, Samoa, Hawaiian Islands, Tonga, and several other islands.
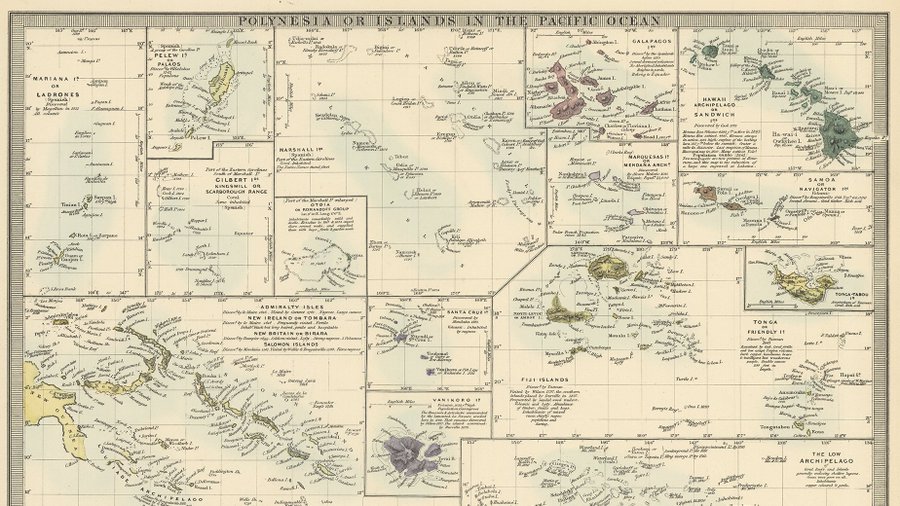
Courtesy: ANU
Meanwhile, Kay Dancey, who manages the CartoGIS services area of the ANU College of Asia and the Pacific, stresses that the maps have also served numerous practical purposes ever since the collection first became available online in 2011. These maps have been used as reference material in a range of research projects including those looking for historic and contemporary infrastructure comparison, the recreation of historic journeys, and Pacific nation land ownership.
In the last year, the collection has seen more than 129,200 downloads from all over the world. You can also access the Asia-Pacific Map Collection for free here.