
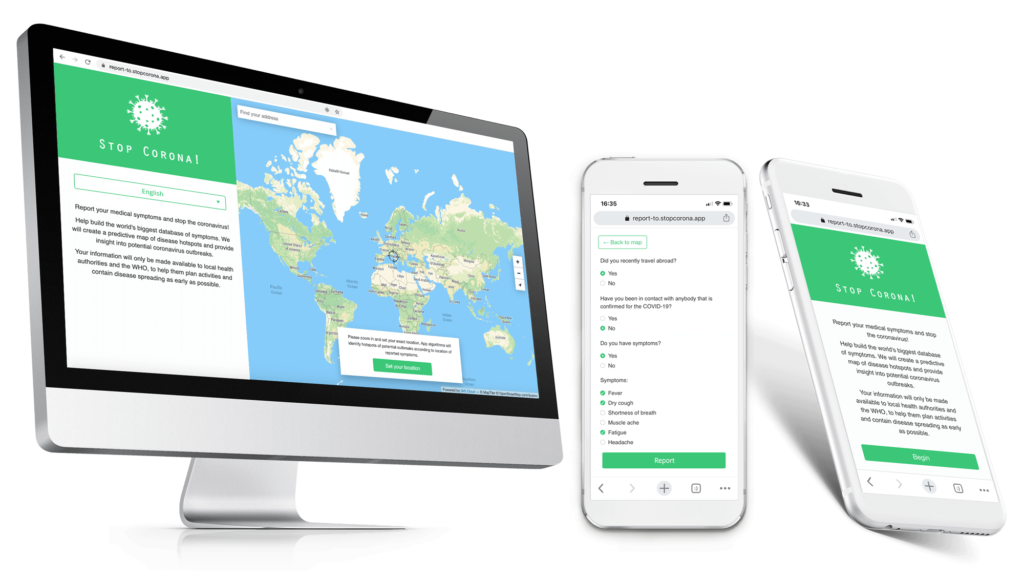
A new anti-corona app, ‘STOP Corona!’ is inviting people from all across the world to report their medical symptoms online in order to create a predictive map of coronavirus (COVID-19) hotspots.
The app creators promise that any data (contact, location, and symptoms) they collect will be kept anonymous and shared only with local health authorities and the World Health Organization (WHO) to provide insights into potential coronavirus outbreaks.
If a potential outbreak is detected in your area, health authorities can then use the information you provided to reach out to you and perform the necessary tests to verify the coronavirus.
It should also be noted that once the collected data reaches 10% of the population in any particular region, the app will start displaying anonymized and aggregated symptom statistics to the public. This step is important because it will help to create awareness among the residents and urge them to double down on the precautionary measures against the coronavirus.
How does the app work?
Using real-time location intelligence and machine learning, ‘STOP Corona!’ predicts patterns and locates hotspots of potential new outbreaks. If you and the people around you report their symptoms daily, the system can single out such areas with a high or increasing concentration of multiple reported symptoms, as an indicator of a potential outbreak.
‘STOP Corona!’ has been developed by Croatia-based GIS Cloud in collaboration with a team of experts, volunteers, and geospatial organizations from across the globe. The app, which collects data securely through an online form with SSL encryption, is completely free and has already been translated into 20 languages.
We also urge you to share this news with your network to help in this global effort of identifying hotspots of potential new coronavirus outbreaks. Stay home and stay safe!

#Business


Next article
The ancient discipline of cartography refers to the art, science, and study of map-making. But modern maps are much more than just a wayfinding tool; they are a bridge between our physical and digital world, encompassing a great deal of information in an easy-to-understand manner. If you have ever wondered what a career in cartography looks like, you have come to the right place.
Ordnance Survey has been mapping Great Britain since 1791, and cartographer Paul Naylor has been helping the national mapping agency do that for more than 22 years now. As a designer and creator of data visualization, Paul is responsible for maintaining a high level of cartography across all OS products and services. Paul is also an active member of the British Cartographic Society, and has written papers, made posters, and presented at numerous cartography and geo events. This is his story…
How did you get into cartography?
I have always loved good design and being creative and have a real passion for getting outdoors and exploring. My intention on leaving college back in 1998 was to take a year out before going to university to study Graphic Design. However, a job advert for a cartographer at Ordnance Survey (OS) caught my eye. OS was looking for people to update a new street-level vector map product called Landplan. This seemed like a great opportunity to pair off two of my passions and get to work for Great Britain’s National Mapping Agency.
In my first 8 years at OS, I worked on several products, honing my skills as a cartographer and eventually getting the opportunity to work on the very popular Explorer map which is a paper map aimed at walkers and cyclists. Then, about 14 years ago, a new department called Cartographic Design was made, allowing its team to focus on designing bespoke mapping and lead the way for designing new products for the OS. I continue to work for this team but under its new guise
What is a typical day for you like?
One of the things I love about my job is how varied and changeable it is. Every day is different for me but I can give you a flavor of the kind of work my team gets up to.
My team’s routes were forged from a need to help OS with designing new products, so a lot of the work we do is the cartography behind new data products, map applications, etc. For instance, our team designed the mapping that supports the OS Maps web and mobile application which gives you access to the most detailed view of Great Britain as well as allowing you to plan and create your routes!
We also support our products by creating a range of marketing and sales material. This could be a simple image for a website or something a little more complex like an animation or data visualization.
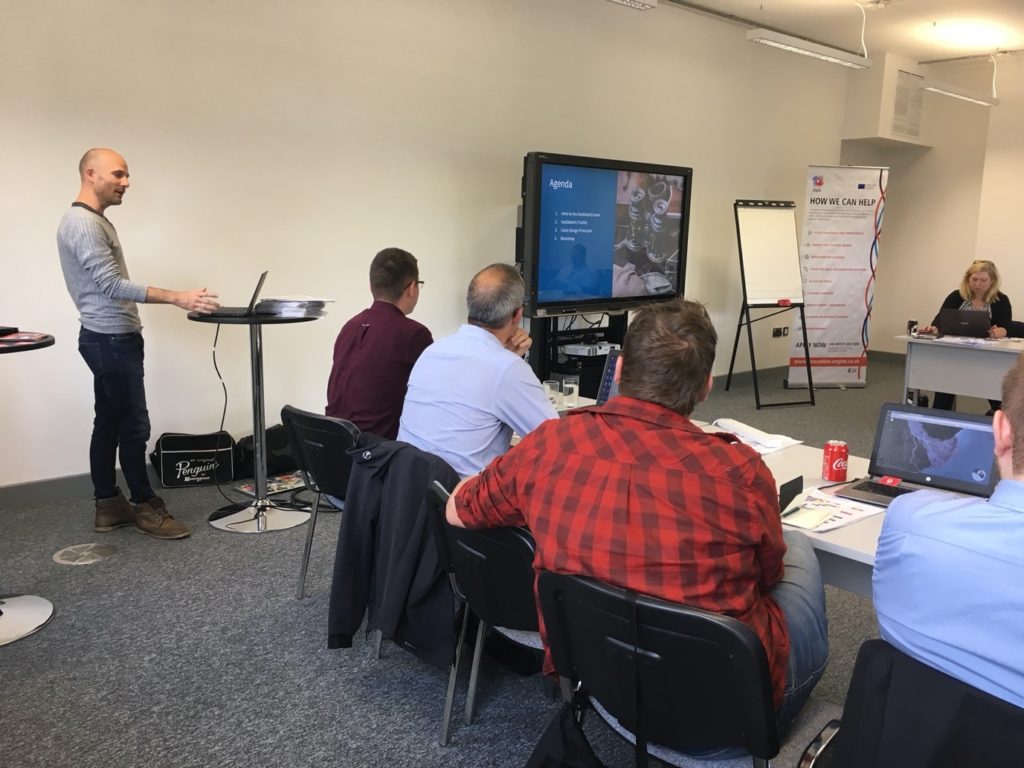
A large part of what we do is supporting our customers and partners. This could be through hosting workshops on how to use and visualize our data or by providing technical support through our Customer Service Centre.
An exciting part of my role is when I get to be a little creative and create something bespoke. For instance, in 2019 I produced a map of the Apollo 11 landing site on the moon in support of the landing’s 50th anniversary. This was a great opportunity to create something truly unique using data from NASA themselves. I even got to be on the telly!
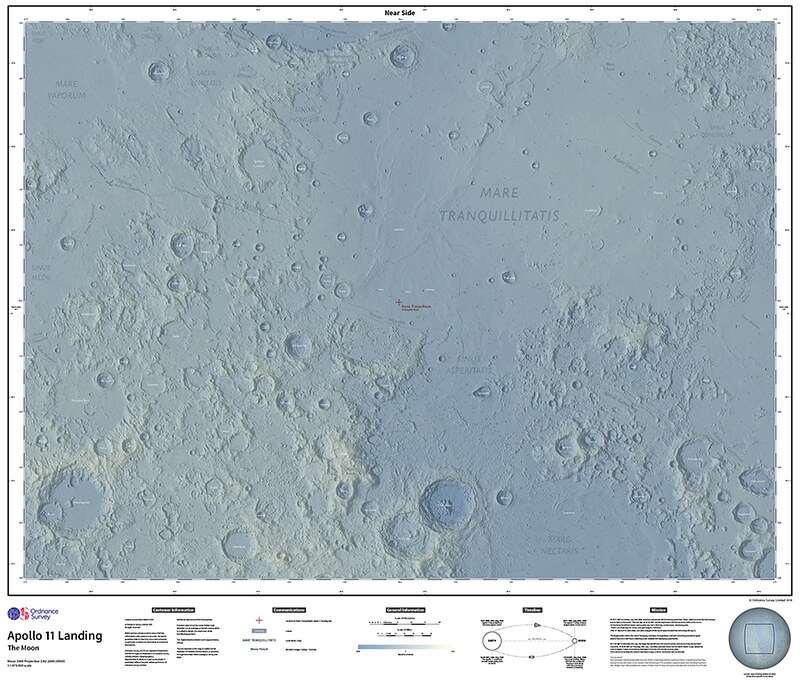
Map of The Moon: 50th Anniversary Edition Map
To give some visual examples of the kind of work we do then take a look at our Flickr pages.
Why did you choose to work with Ordnance Survey?
OS is a national institution and someone who I am very proud to work for. They have an amazing history with their routes grounded in military strategy. The OS has played an important part in the war effort, with many of its staff being called up to the front line as well. They printed 33,000,000 maps for World War l and an astonishing 342,000,000 for World War ll. Oh, the head office is only a 30-minute drive from my house too!
What is your favorite part about your job?
It’s difficult to decide as I have so many! Right now, I am really enjoying sharing some of my knowledge and expertise to a wide range of people through workshops, presentations, blog posts, and webinars. It’s great to see so much enthusiasm in people to learn something new, especially around cartography and data visualization. There is so much data being collected daily that it is important that those who visualize it have the skills and knowledge to do it properly.
How has mapmaking changed in the last two decades that you have been on the job?
For me, there have been two big changes. The first big change is the technology. Making maps quickly has never been so easy, however, that brings its own problems. Everyone thinks they can make a map, but cartography (the art and science behind making a map) is a real skill that is often not taught to people that use geographic data daily. The technology advances are great for the industry though. No longer is it just Geographic Information Systems (GIS) that allow us to interact with and visualize geographic data. There are some other amazing software available that allows us to create maps through dashboards, story maps, animations, websites, etc.
The second change is the amount of data that now exists. We live in a connected world where we are constantly capturing data that can be used for the better. It’s great that a lot of this data is open and free for people to make use of and this is a big reason why the technology has also changed so much over the last few years.
Do your GIS skills come in handy often?
I use GIS every week and it is a key part of my role but as each day is different you never know how much you might need to stretch that skillset! It could be that I just need to put a quick map or map style together or I might need to help solve a customer query or problem that requires some analysis of our data.
What does it take to create not just a map, but a good map?
There is no magic formula but there are some guidelines you can follow to help make your map as good as possible:
- Make sure you understand who will be using your map and what information the map user requires in order for your map to work.
- When designing your map make sure you consider how the map will displayed. Will it be printed or will it be displayed on screen? Or both?
- Keep it simple. Don’t add information to your map that is not needed. Less is more.
- Make sure all the map elements are legible. For instance, use fonts that work and make sure text and symbols do not overlap.
- Don’t be afraid to ask for critique. It is an important part of the learning process and even the best at their jobs still ask their peers to critique their work.
A few years ago, our team created a set of Carto Design Principles which we adhere to when we approach all of the work we do. They are not rules by any means but more a set of guidelines to help you and they can be found here.
What advice would you give to aspiring cartographers?
A few things I think could help:
- Use social media and start following some other cartographers and data viz experts. They are great for inspiration or asking for help. I’m on Twitter under @cartocraftsman and I have connected with some great people who have helped me in my career.
- Join at least one cartographic organization if you can. I am part of the British Cartographic Society (BCS) and currently sit on their council. It’s a great way to connect and be part of a wider cartographic family.
- Get a portfolio together and start sharing. Don’t be afraid to get your work noticed as most people are kind and will give you constructive feedback where warranted. There are also some great cartographic awards for you to enter so its worth having a look at those too. The BCS have some of their own which you can find here.