
 The outbreak of COVID-19 has a profound impact on our mobility. For the past weeks, most of us stayed home, which is not only driven by travel and gathering restrictions but mainly by our responsible behaviour trying to “flatten the curve”. How long will we be forced to stay home? Some experts say a few weeks, other a few months… Regardless of that, changes in our mobility model will stay with us for a long time to come.
The impact of the lockdown on our mobility can be of course measured using various geographic data sources. Below you will find examples of some of the ways organizations across the globe use to measure it.
Road Traffic
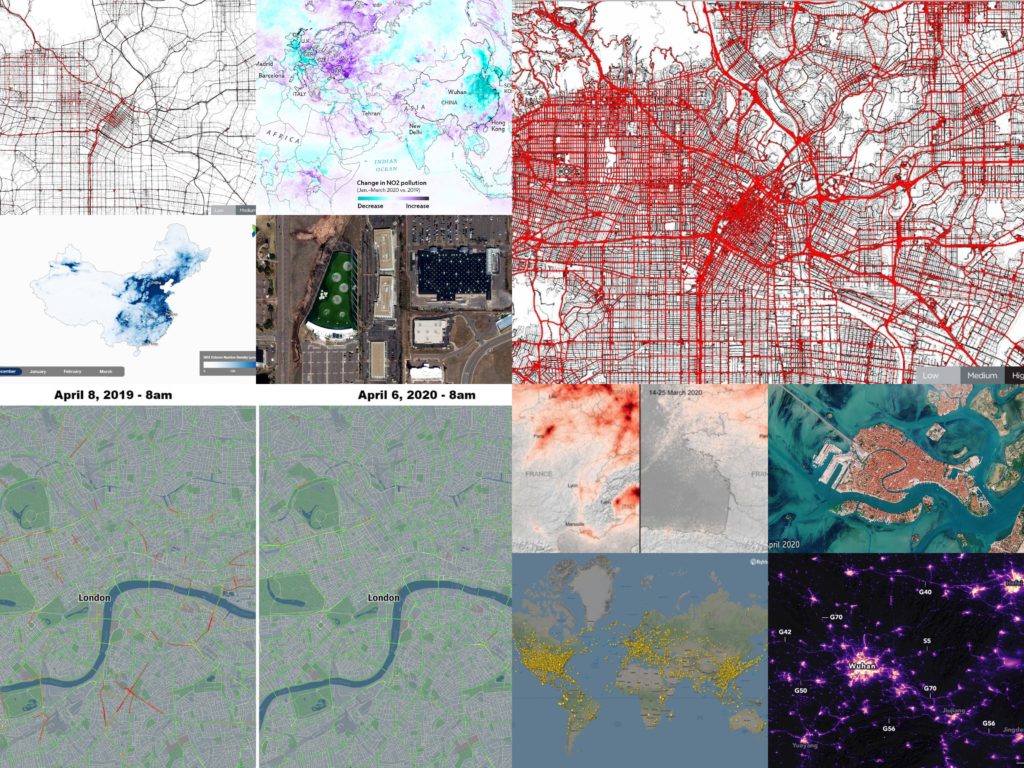
Both TomTom, and HERE measured the impact of the pandemic looking at traffic data. TomTom compared typical Monday traffic from January, 24th and April, 6th 2020 in cities around the world and concluded that the traffic volumes dropped typically by 65-85%, which practically means no traffic congestion at all.
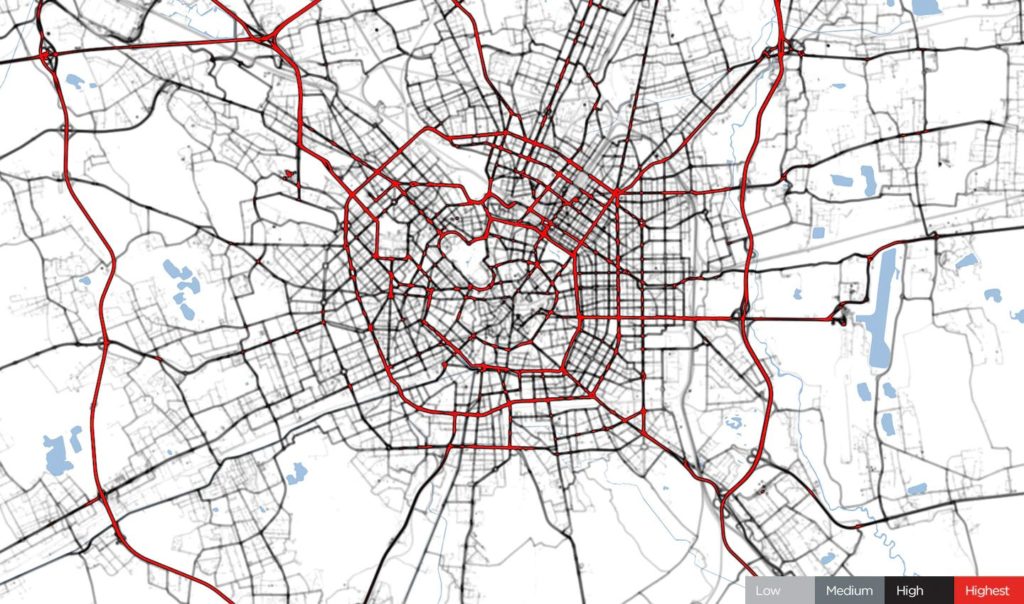
Milan, January 24, 2020. Before COVID-19 restrictions, source: TomTom
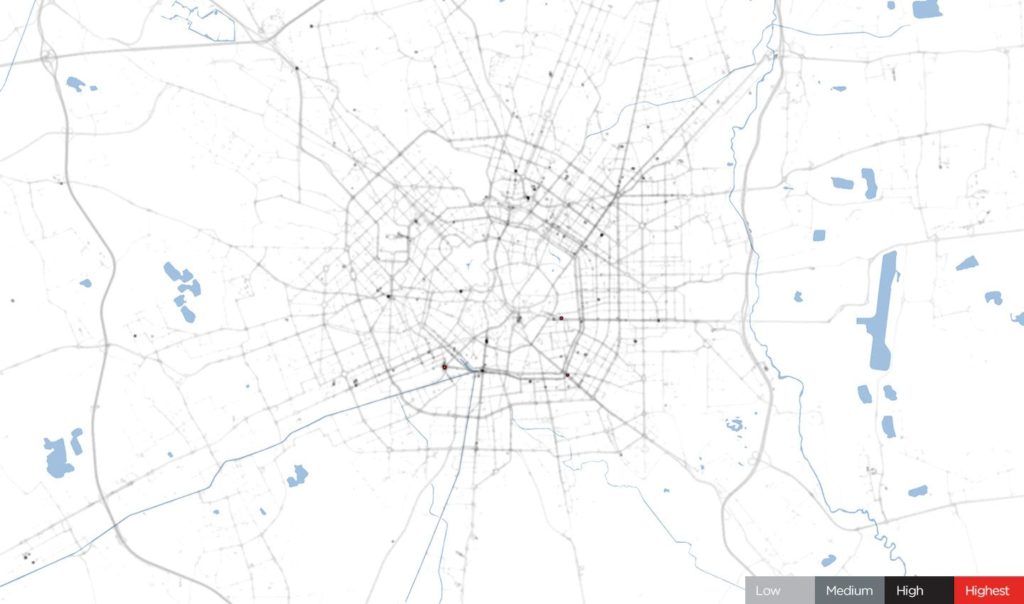
Milan, April 6, 2020. During COVID-19 restrictions, source: TomTom
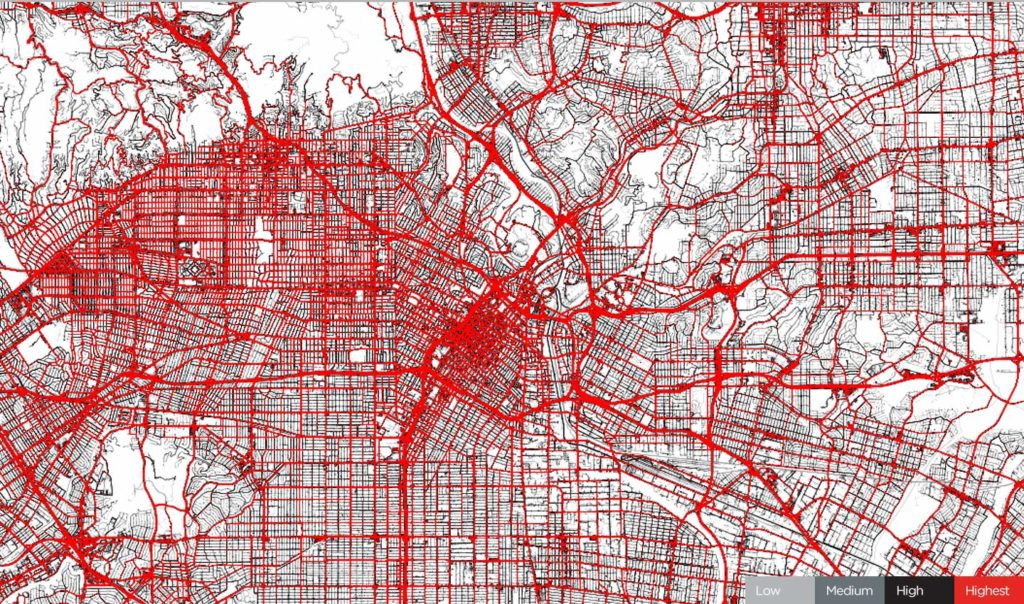
Los Angeles, January 24, 2020. Before COVID-19 restrictions. Source: TomTom
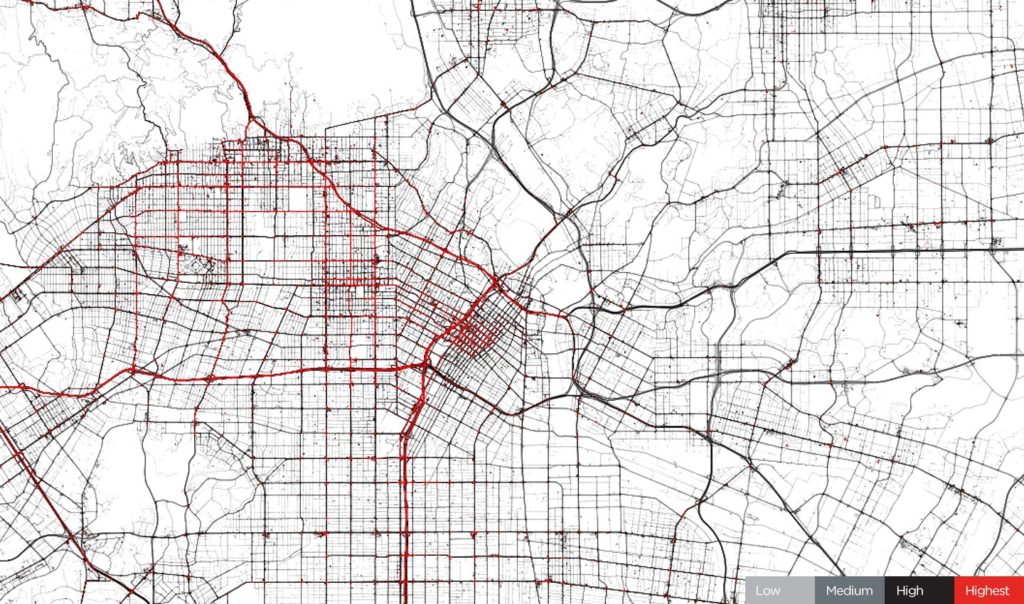
Los Angeles, April 6, 2020. During COVID-19 restrictions. Source: TomTom
HERE analysis compared peak time travel at 8 am on April 8th, 2019 and at the same time and roads on April 6th, 2020. Using this methodology the drop in traffic in major European capitals reached over 96%.
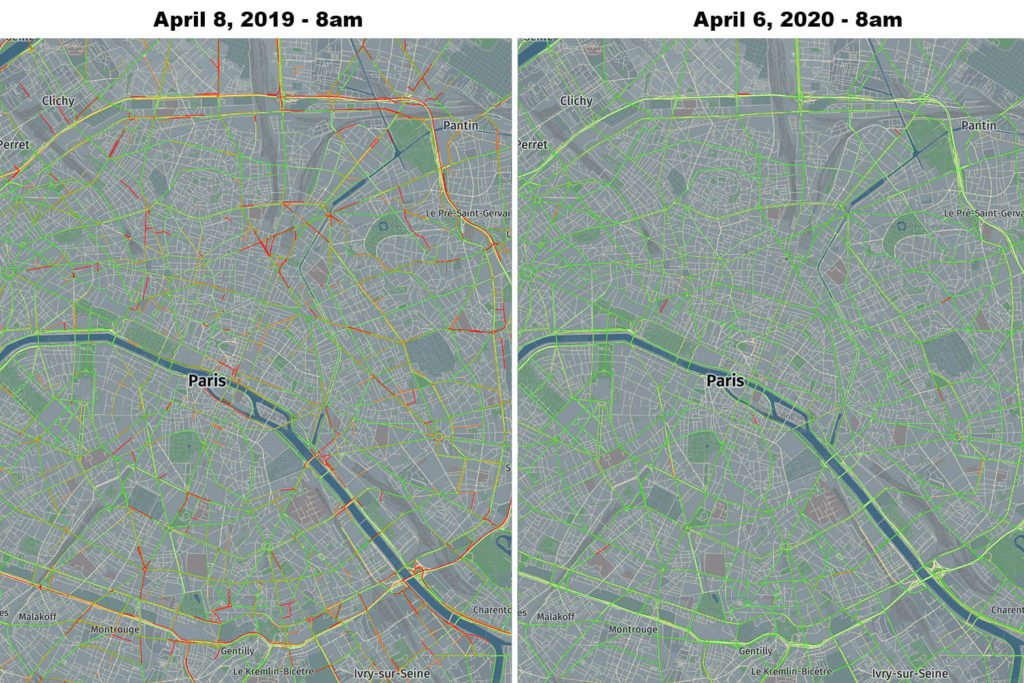
Paris – 96.8% reduction in traffic, source: HERE
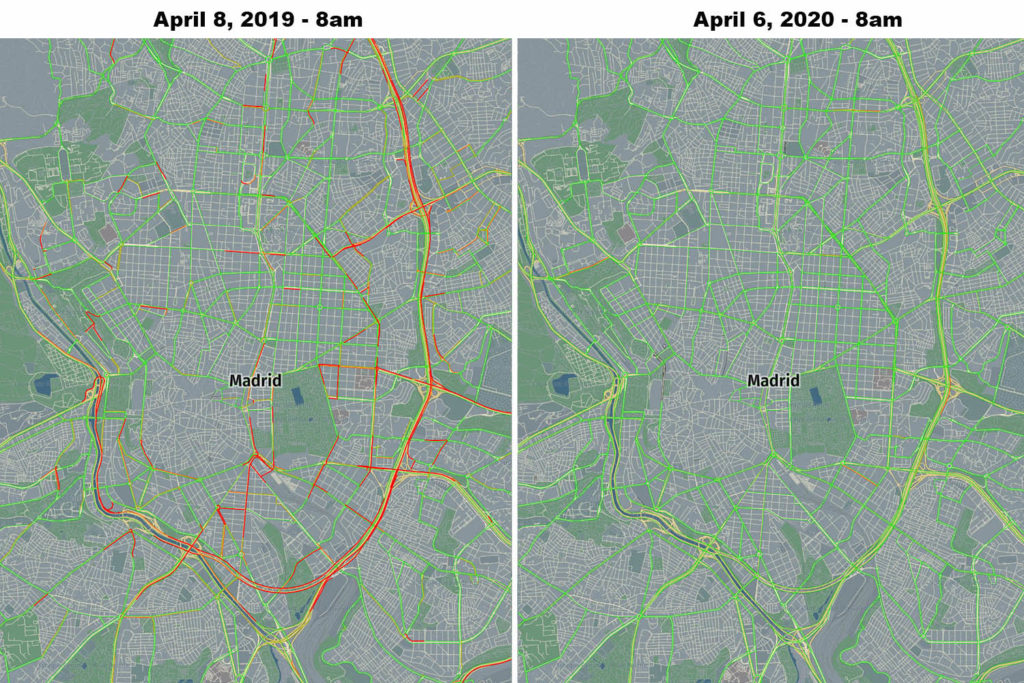
Madrid – 96% reduction in traffic, source: HERE
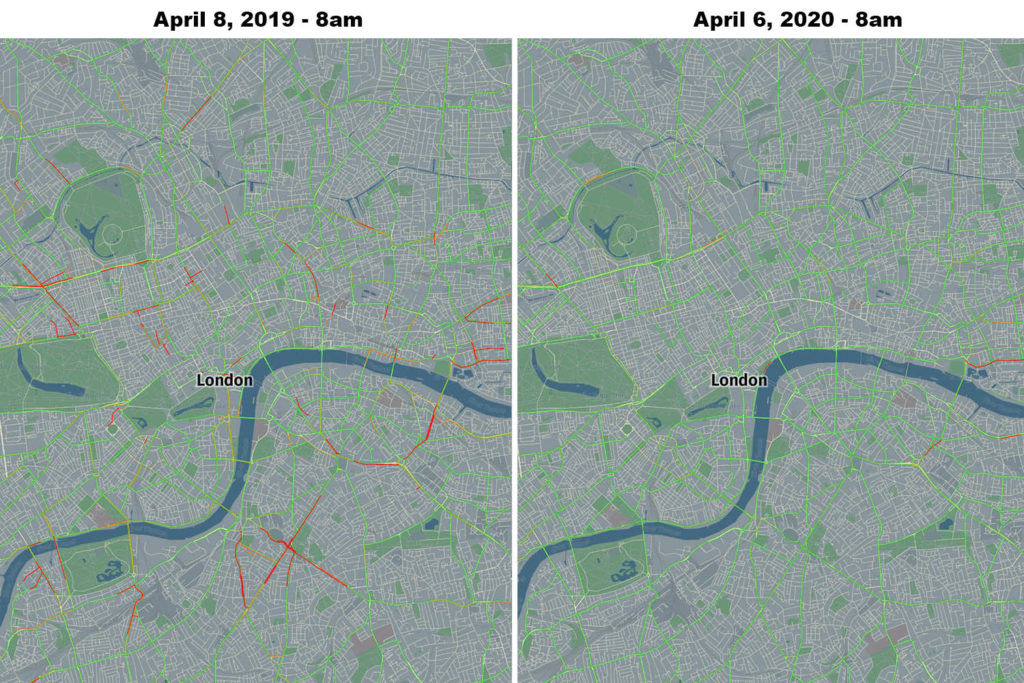
London – 90.2% reduction in traffic, source: HERE
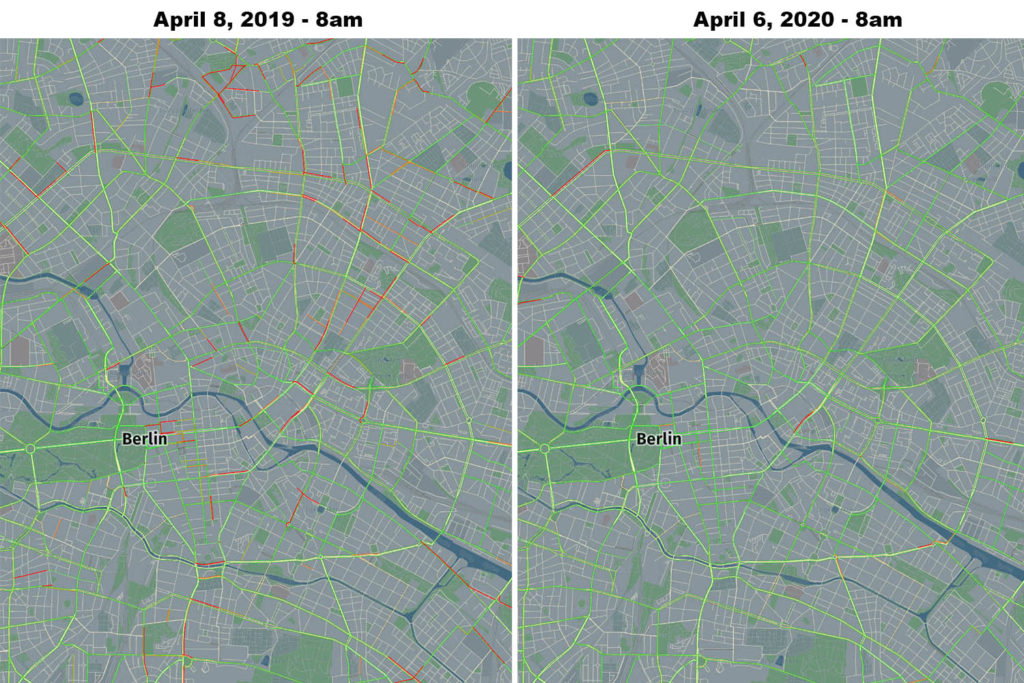
Berlin – 72.2% reduction in traffic, source: HERE
Air traffic
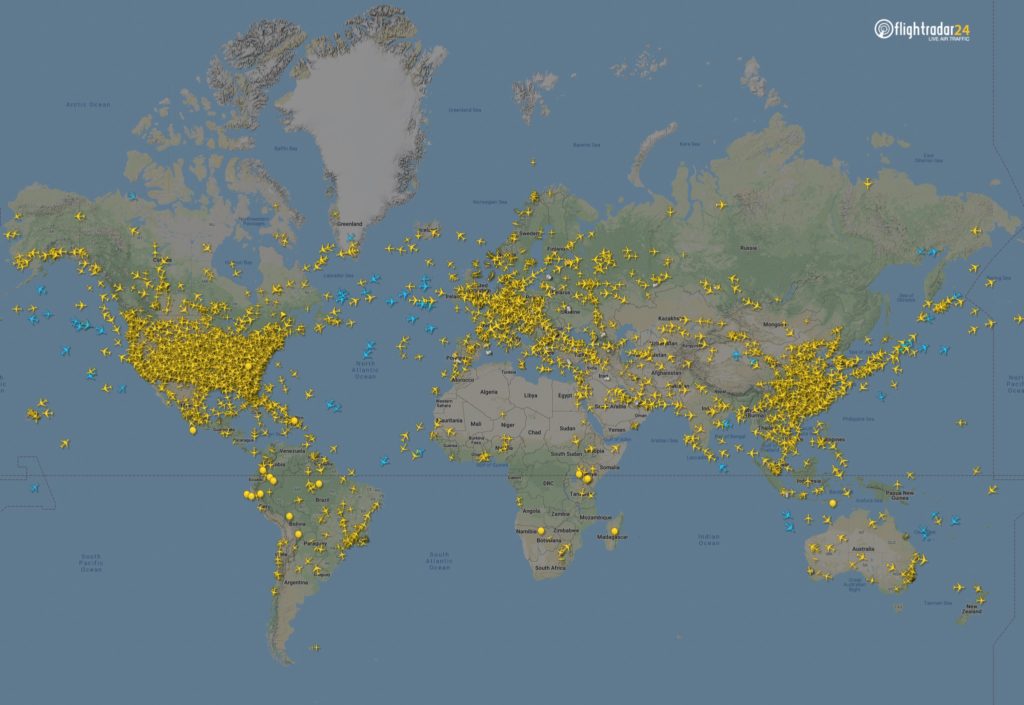
Air travel is another mobility domain of our life affected by the pandemic. Flightradar24 published a series of maps and charts showing a drop of air activity around the world.
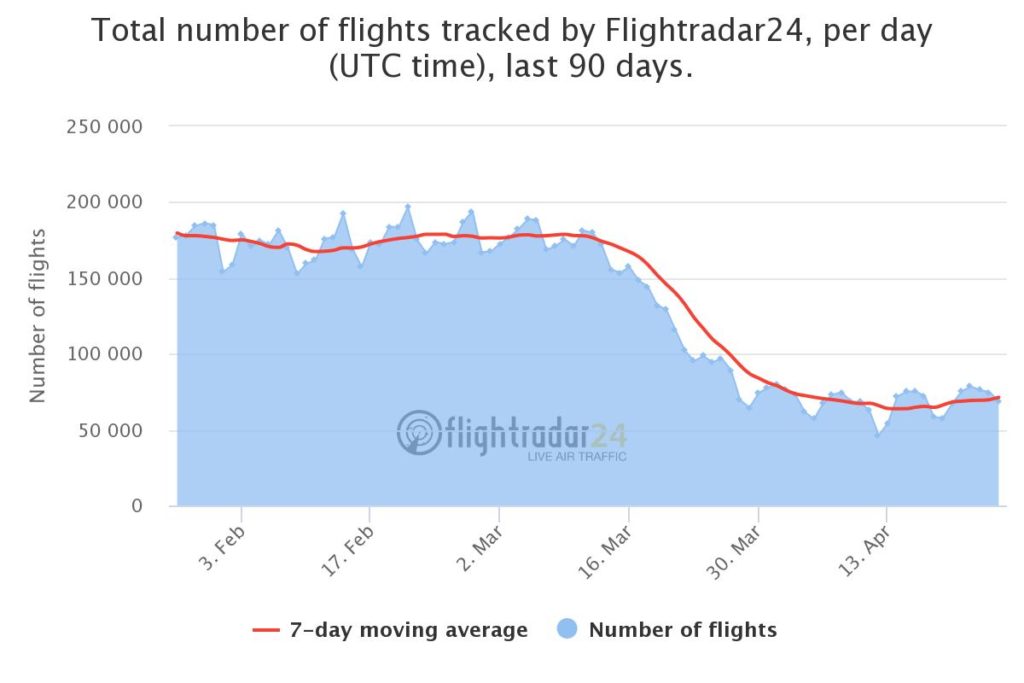
Majority of commercial passenger flights has been stopped, leaving mainly cargo and non-commercial aviation in the air. The portal created a snapshot of all flights in the air at 15:00 UTC on March 7 and April 7 2020. The number of flights at that moment in time dropped globally from 15,012 flights to 5,275.
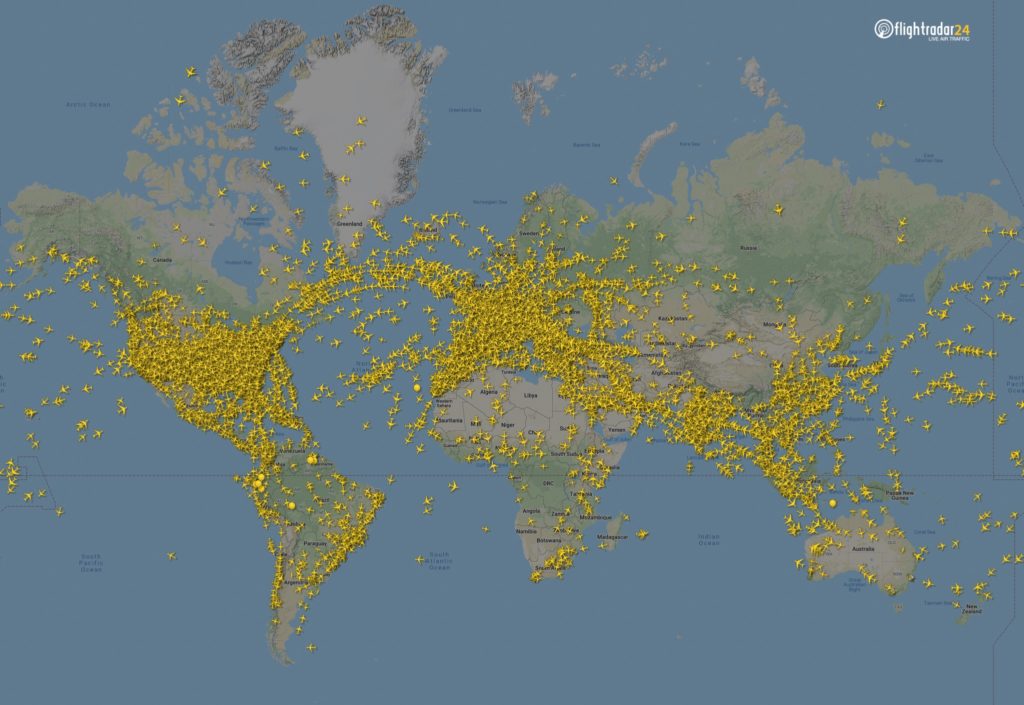
15,012 flight in the air, 7 March at 15:00 UTC
5,275 flight in the air, 7 April at 15:00 UTC
Flights in North America have declined considerably. The image from 18:00 UTC on 7 March shows 8,400 flights, while the 7 April displays just 2,950 flights.
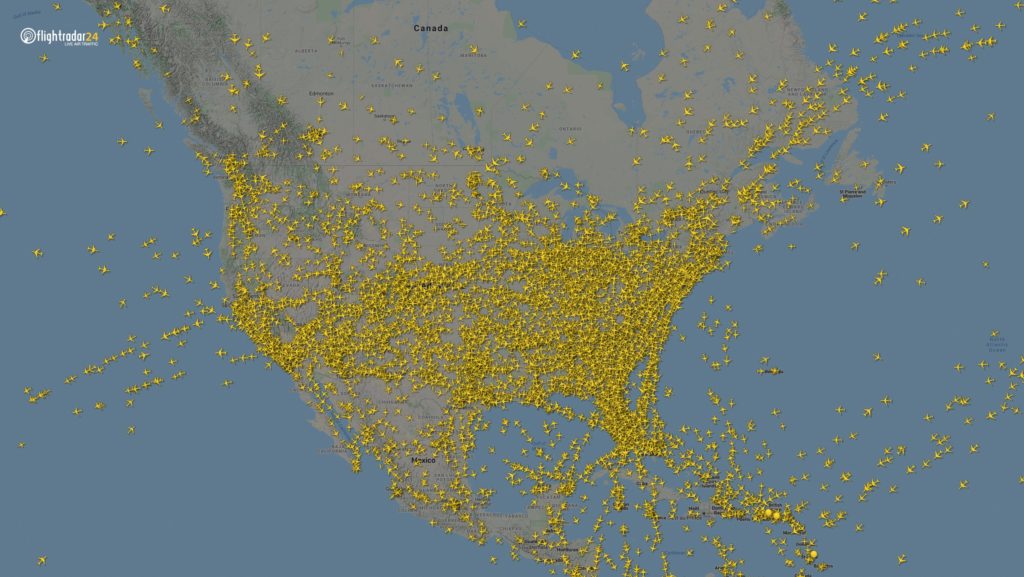
8,400 flight in the air, 7 March at 18:00 UTC
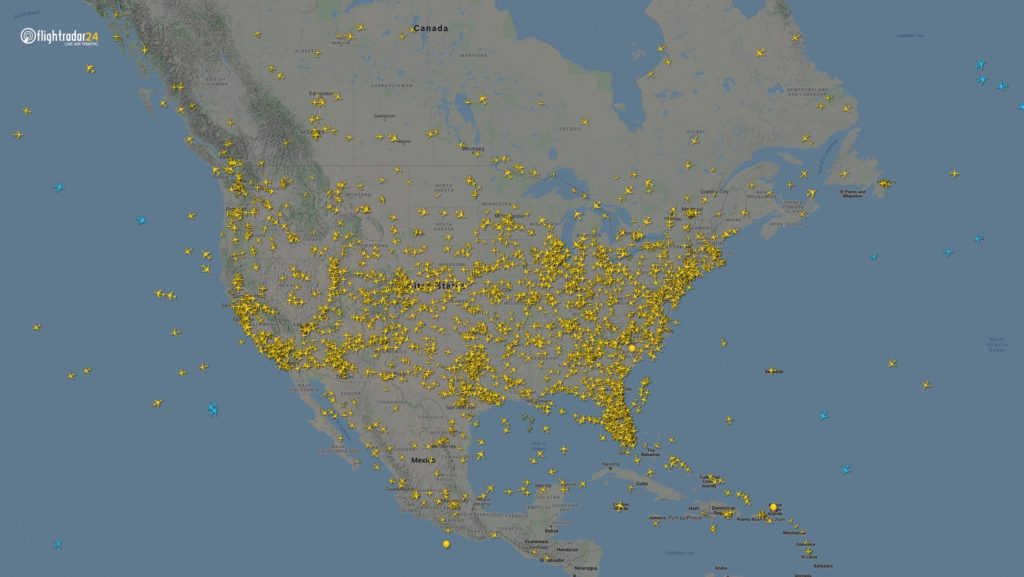
2,950 flight in the air, 7 April at 18:00 UTC
European skies have also quieted significantly. The difference between the March and April images below is a decrease of 2,400 flights.
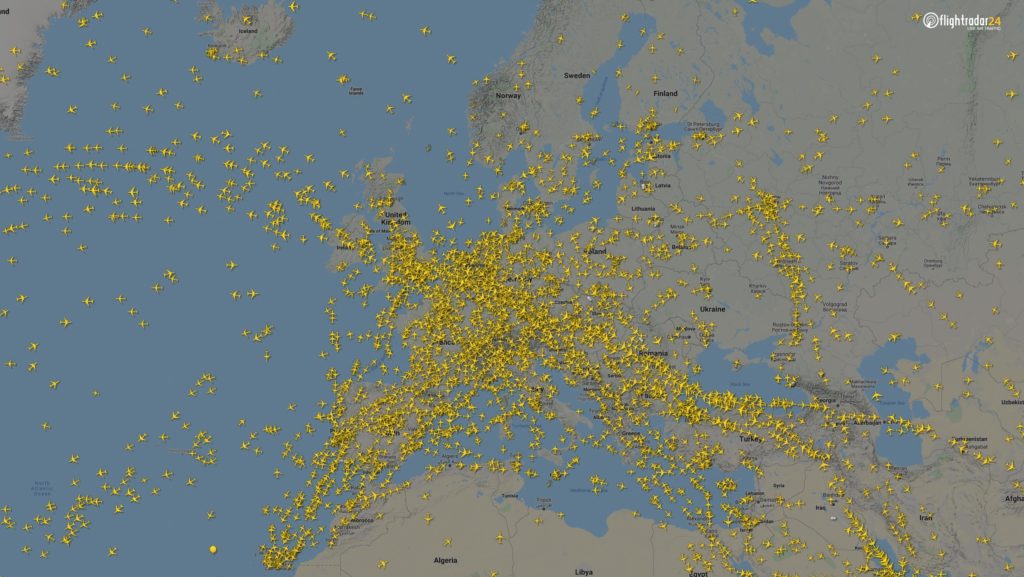
7 March at 15:00 UTC
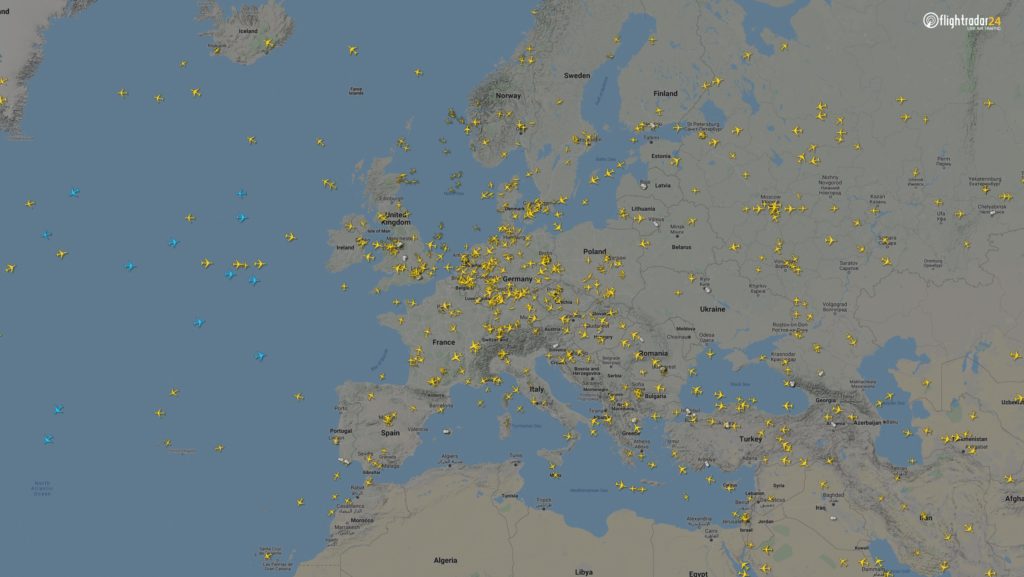
7 April at 15:00 UTC
Air pollution
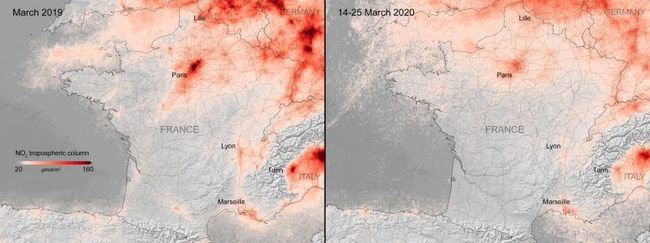
Another way to measure a drop in our industry and transportation patterns is related to measuring air pollution. European Copernicus Sentinel-5P satellite mapped a significant drop in nitrogen dioxide concentrations air pollution across the continent.
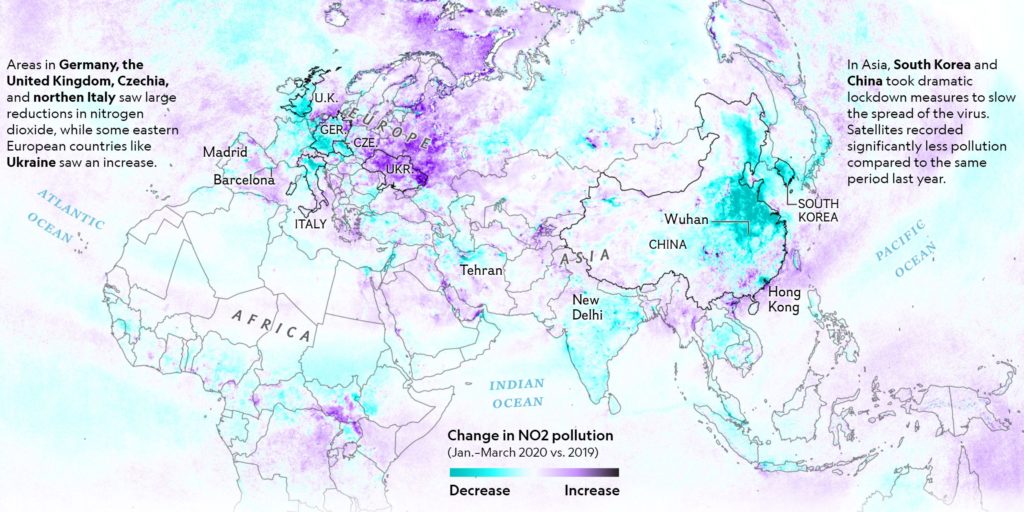
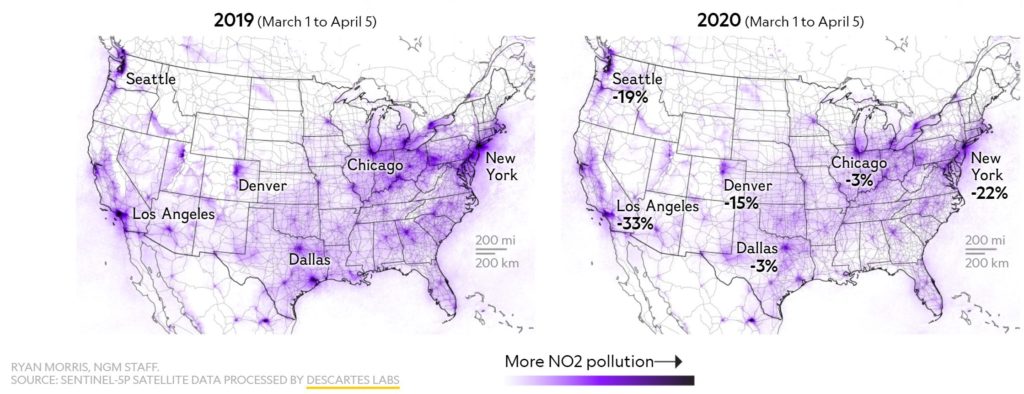
National Geographic created an extensive analysis and mapping of the NO2 pollution drop across the world
Another interesting analysis has been created by the European Environmental Bureau showing the impact of the January-February lockdown in China.
source: European Environmental Bureau
Interestingly, according to calculations done by Marshall Burke, an Earth system scientist at Stanford University, in China, the drop in pollution resulting from coronavirus shutdown is likely to save between 53,000 and 77,000 lives so much more than killed by the virus itself.
Satellite images
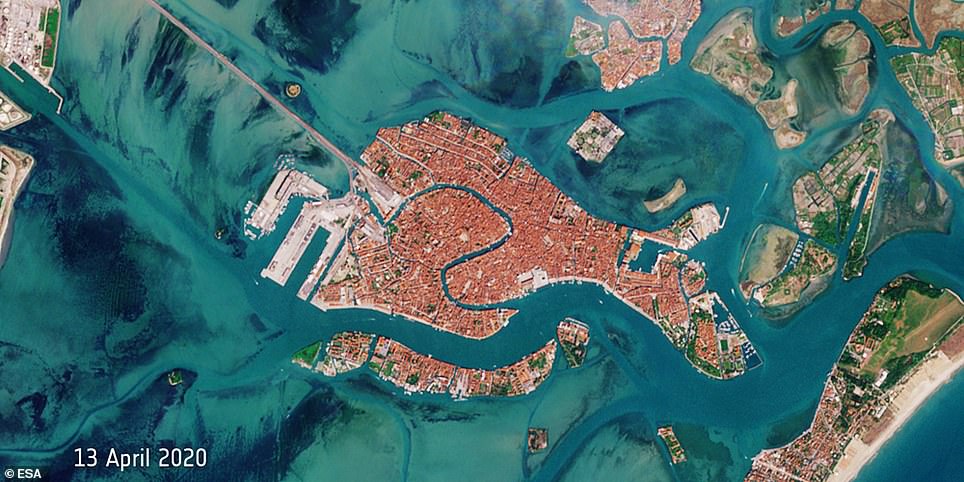
Another source of geospatial intelligence that indicates the mobility drop are satellite imagery. The Venice channels typical full of maritime activity are now nearly fully empty.
![]()
With sports clubs and shopping malls closed, we see a significant drop in human activity around these places.
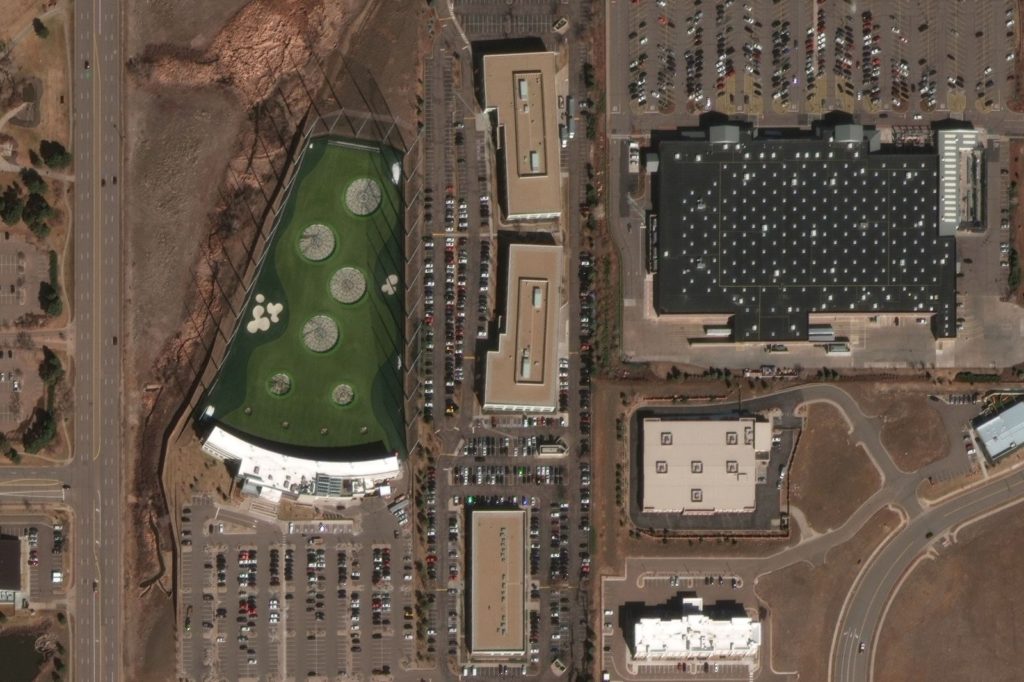
Top Golf and Walmart in Colorado, before Covid-19 Restriction on March 10, 2020

Top Golf and Walmart in Colorado, after Covid-19 Restriction on March 24, 2020
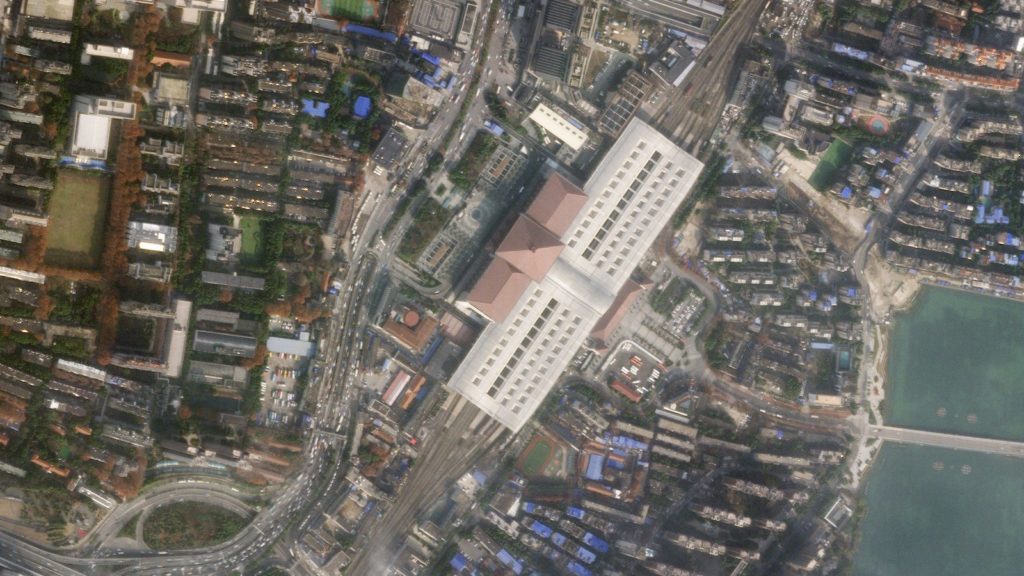
Train Station Wuhan, China before Covid-19 lockdown
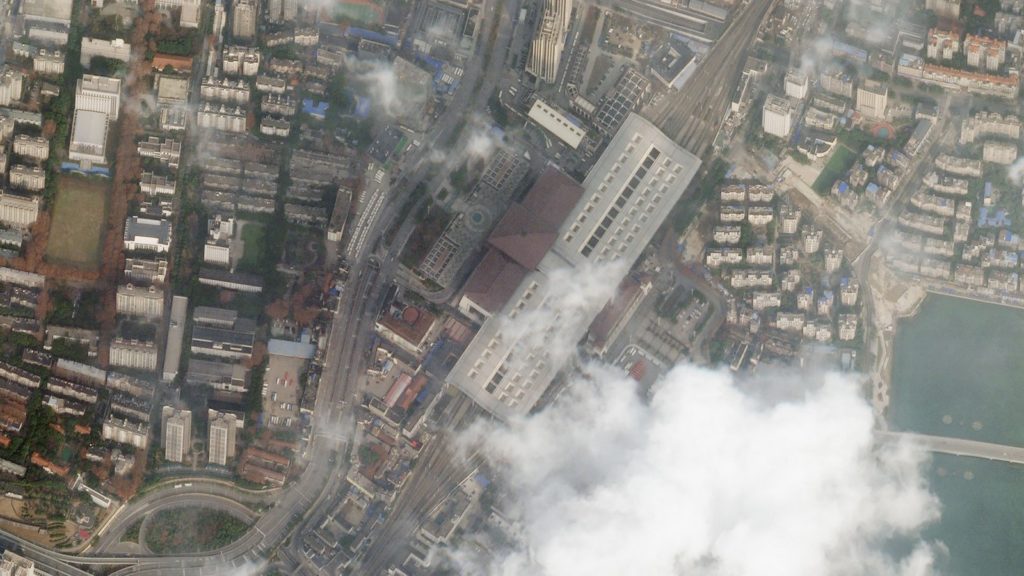
Train Station Wuhan, China after Covid-19 lockdown
Night lights
Another interesting indicator that can be measured using geospatial data is light pollution. As China came to terms with the gravity of the COVID-19 pandemic outbreak with the dawn of the New Year, the government suspended air, road, and rail travel in the Hubei province and placed restrictions on other activities in the region in late January 2020. This pronounced change in human activity reflects clearly in the nighttime images captured by NASA’s satellites around the city of Wuhan, China, between January 19 and February 4, 2020.
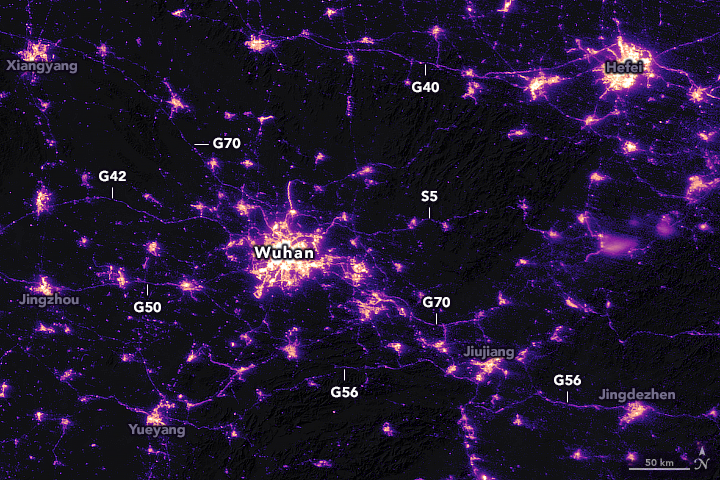
Wuhan, China, January 19, 2020

Wuhan, China, February 4, 2020
Stay safe!

#Featured


Next article
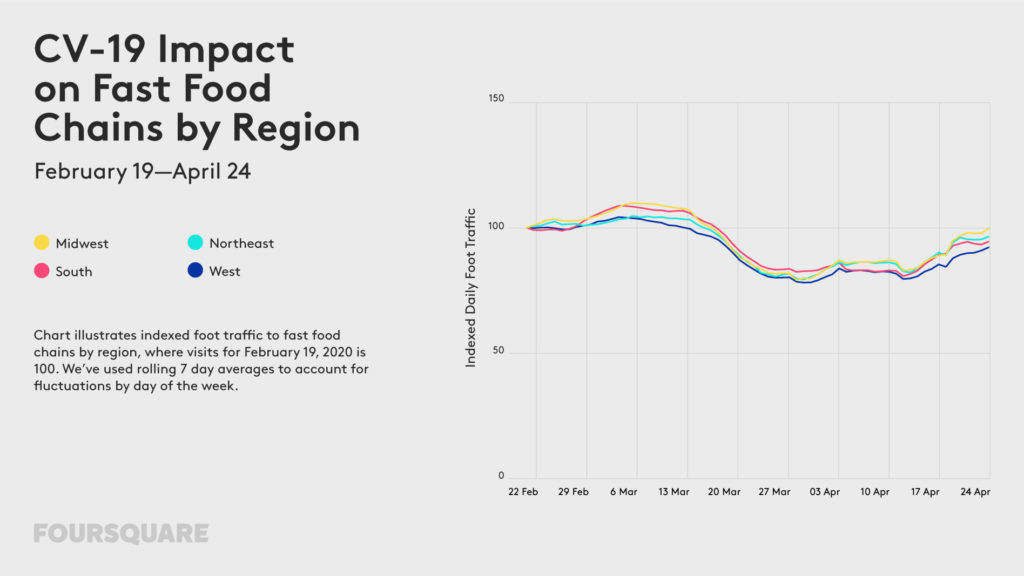

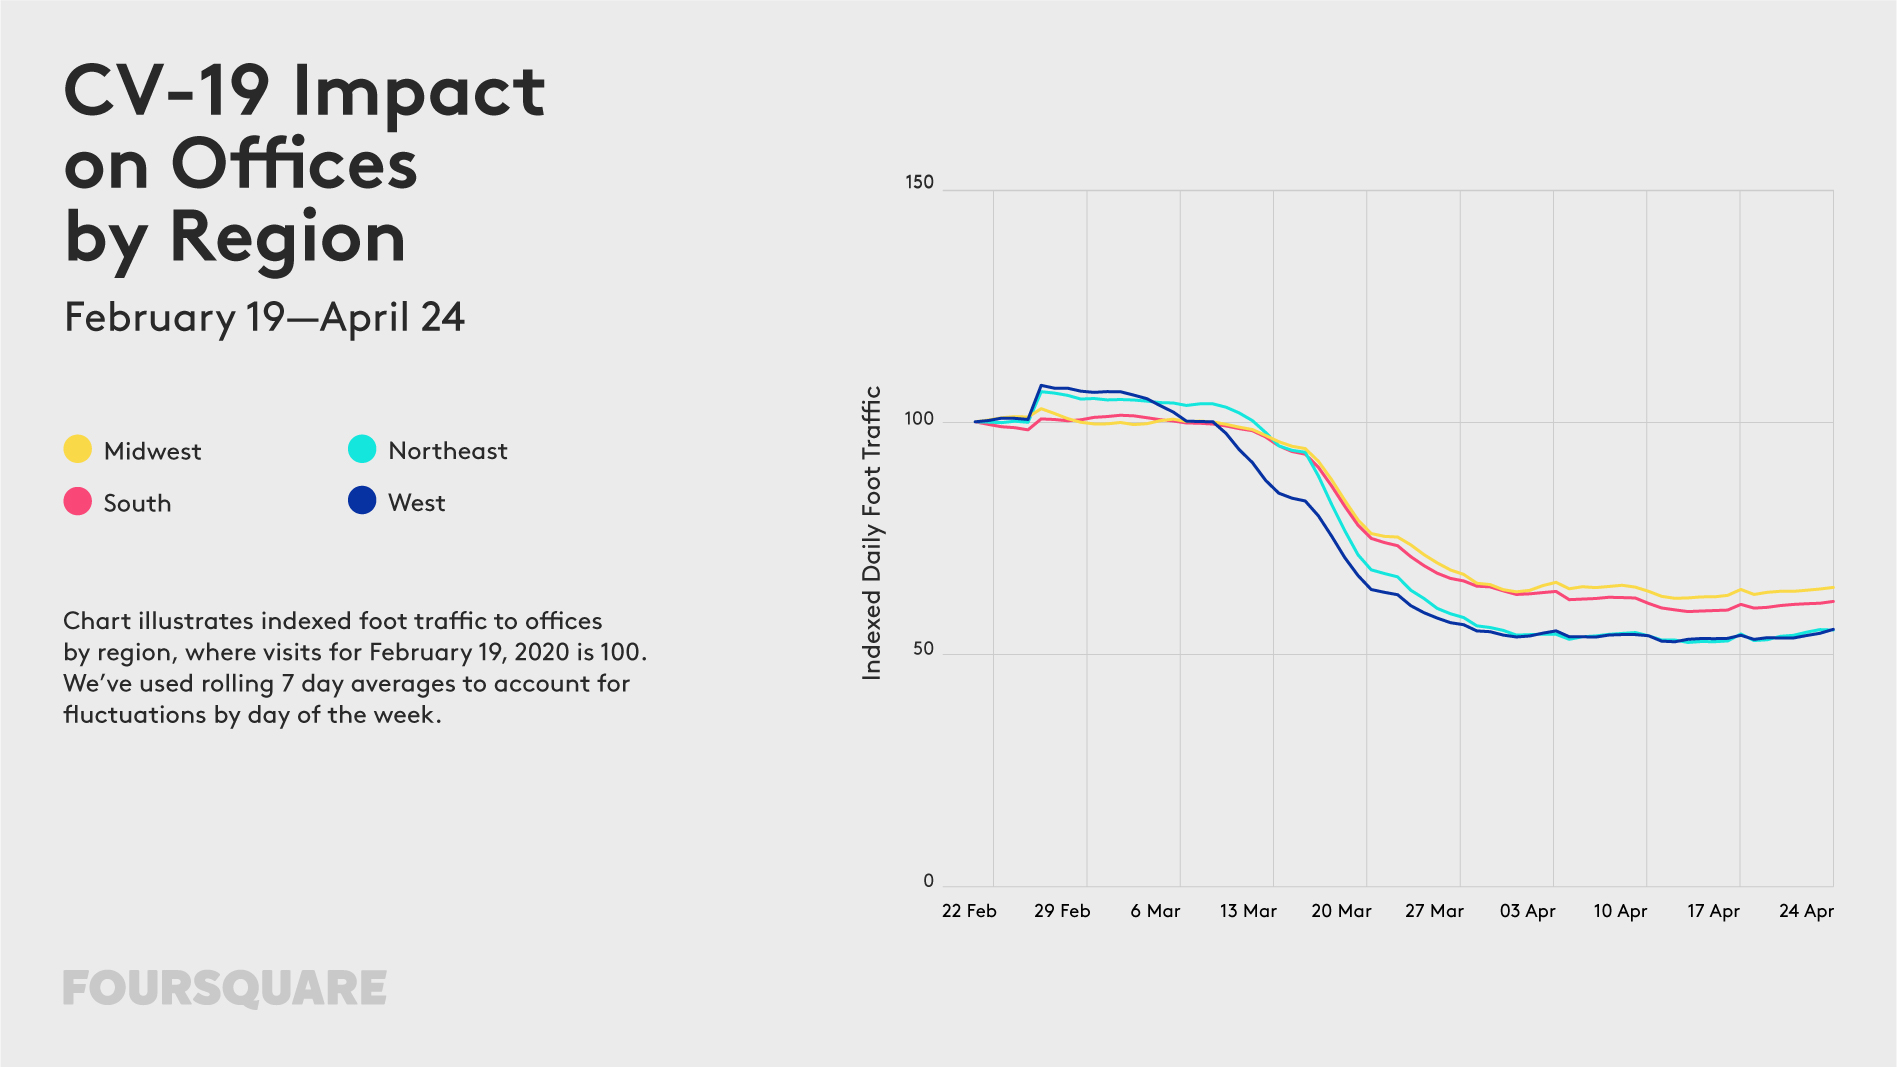
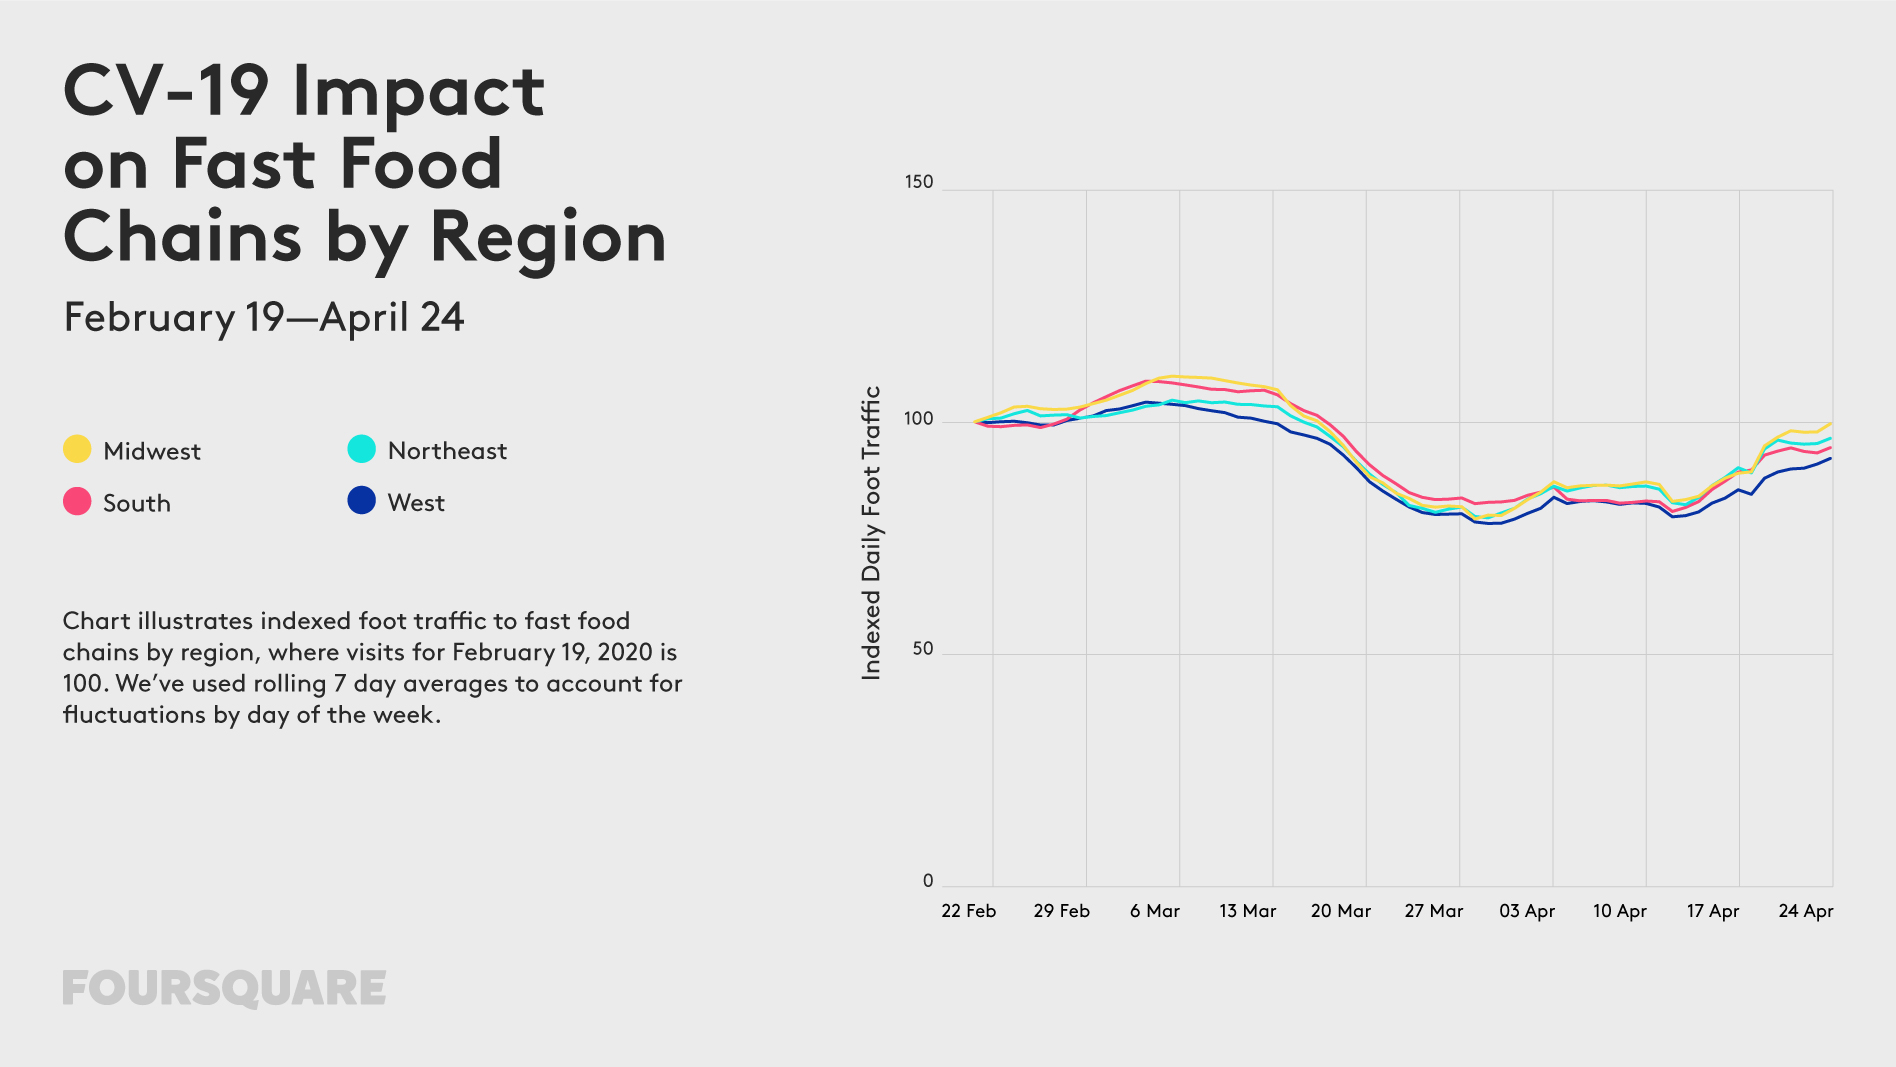
Foursquare has spent the last few months studying how COVID-19 is affecting foot traffic across the United States. On April 30, the location intelligence company revealed the analysis of foot traffic trends from February 19, when community transmission of the novel coronavirus was first detected in the country, through April 24.
And what does that analysis tell us? That regardless of state-specific policies on the relaxation of coronavirus-related restrictions, people are feeling the itch to get back to the real world. While foot traffic had majorly bottomed out around the end of March, by April-end, upticks could be witnessed, indicating that consumer behavior is getting back to normal.
According to Foursquare data, fast food and gas station visits have returned to pre-COVID-19 levels in the Midwest and rural areas. Even casual dining restaurants are starting to show upticks, but that could also be prompted by new curbside takeaway options. Also, there has been a significant spurt in foot traffic to home improvement stores, which is a permissible destination in most US states.
These findings by Foursquare are based on anonymized and aggregated location data taken from the mobile apps of 13 million Americans who are a part of the company’s ‘always-on’ panel. “Men, and generally people between the ages of 35-64, have shown more moderate declines across different types of places, and are also showing greater propensity to return,” Foursquare explains in a blog post.
Let’s take a deeper look at the foot traffic patterns for QSRs, gas stations, grocery stores, hardware shops, trails, and offices.
Fast Food Chains: Foot traffic to quick-service restaurants (QSRs) has risen over the past several weeks, with traffic down only 5% nationally as of April 24.
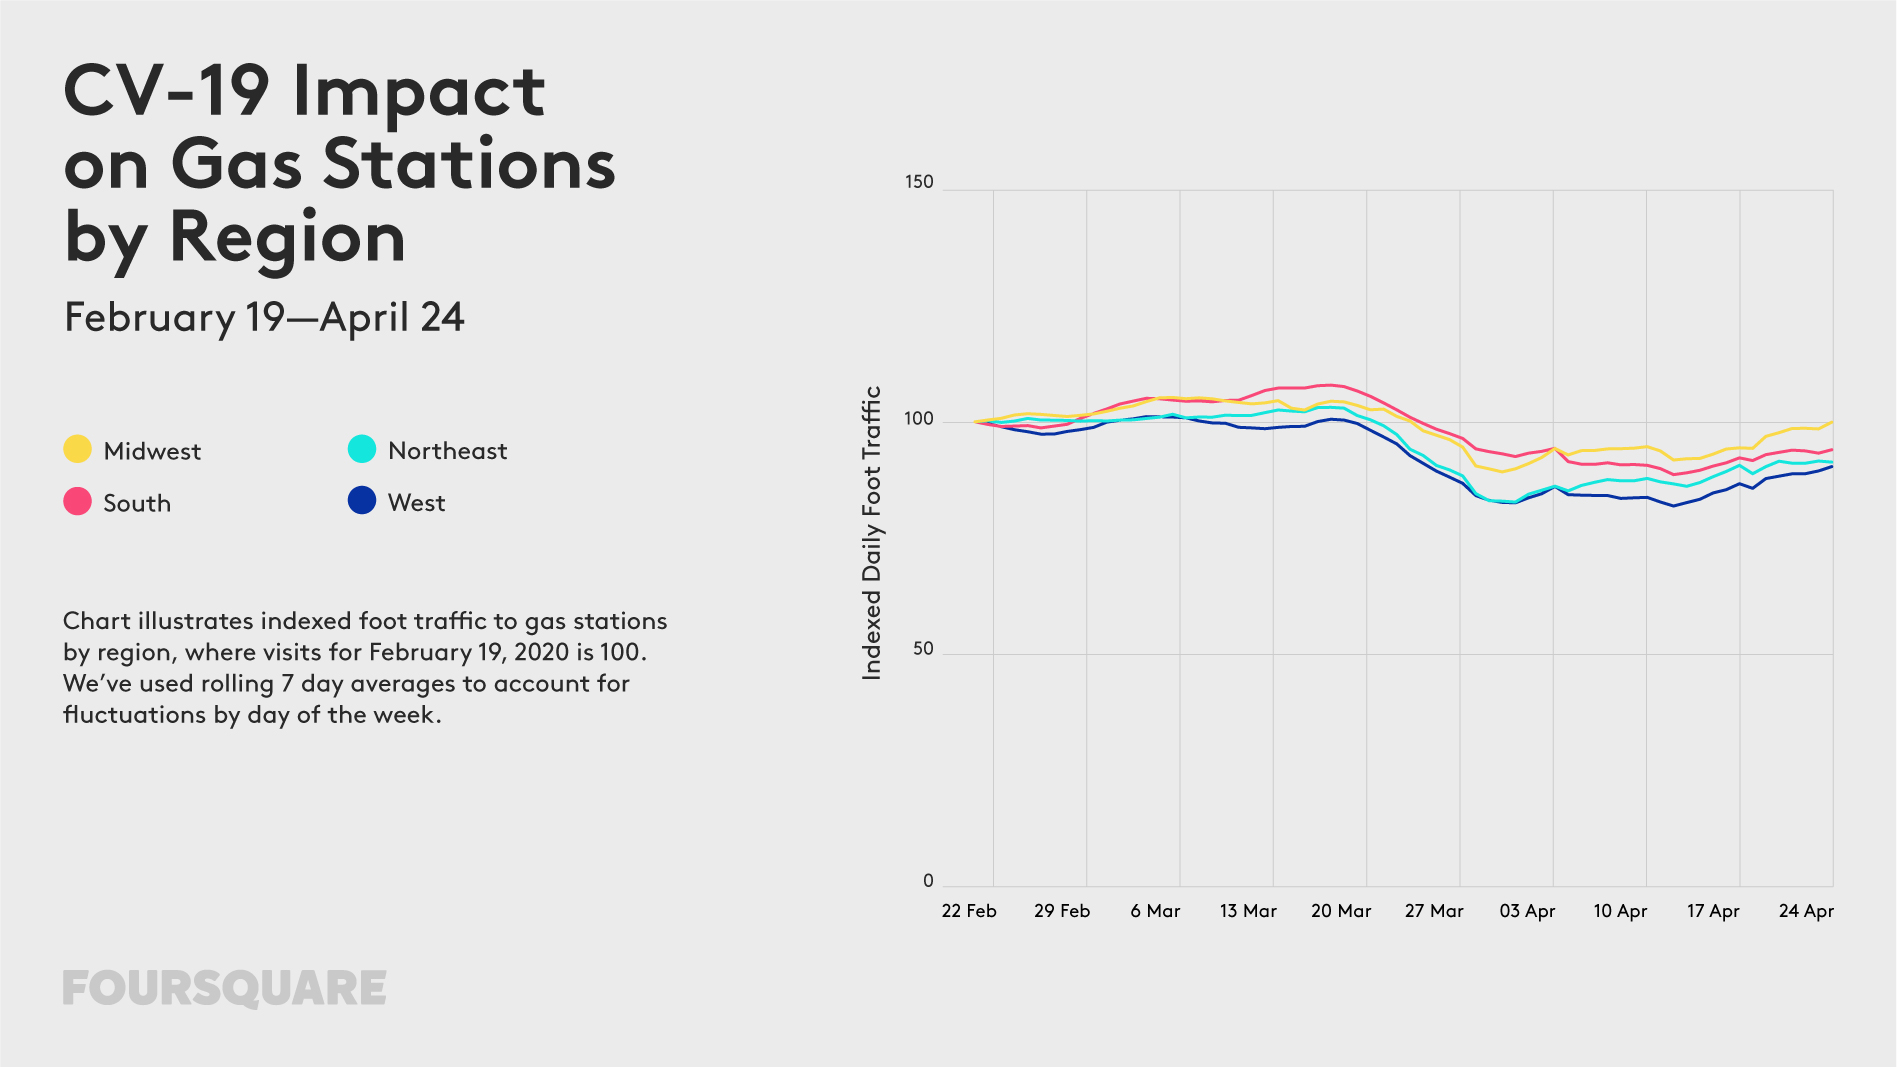
Gas Stations: Gas station visits have increased slightly since mid-April, down only 6% nationally as of April 24 (versus 8-11% in the weeks prior).
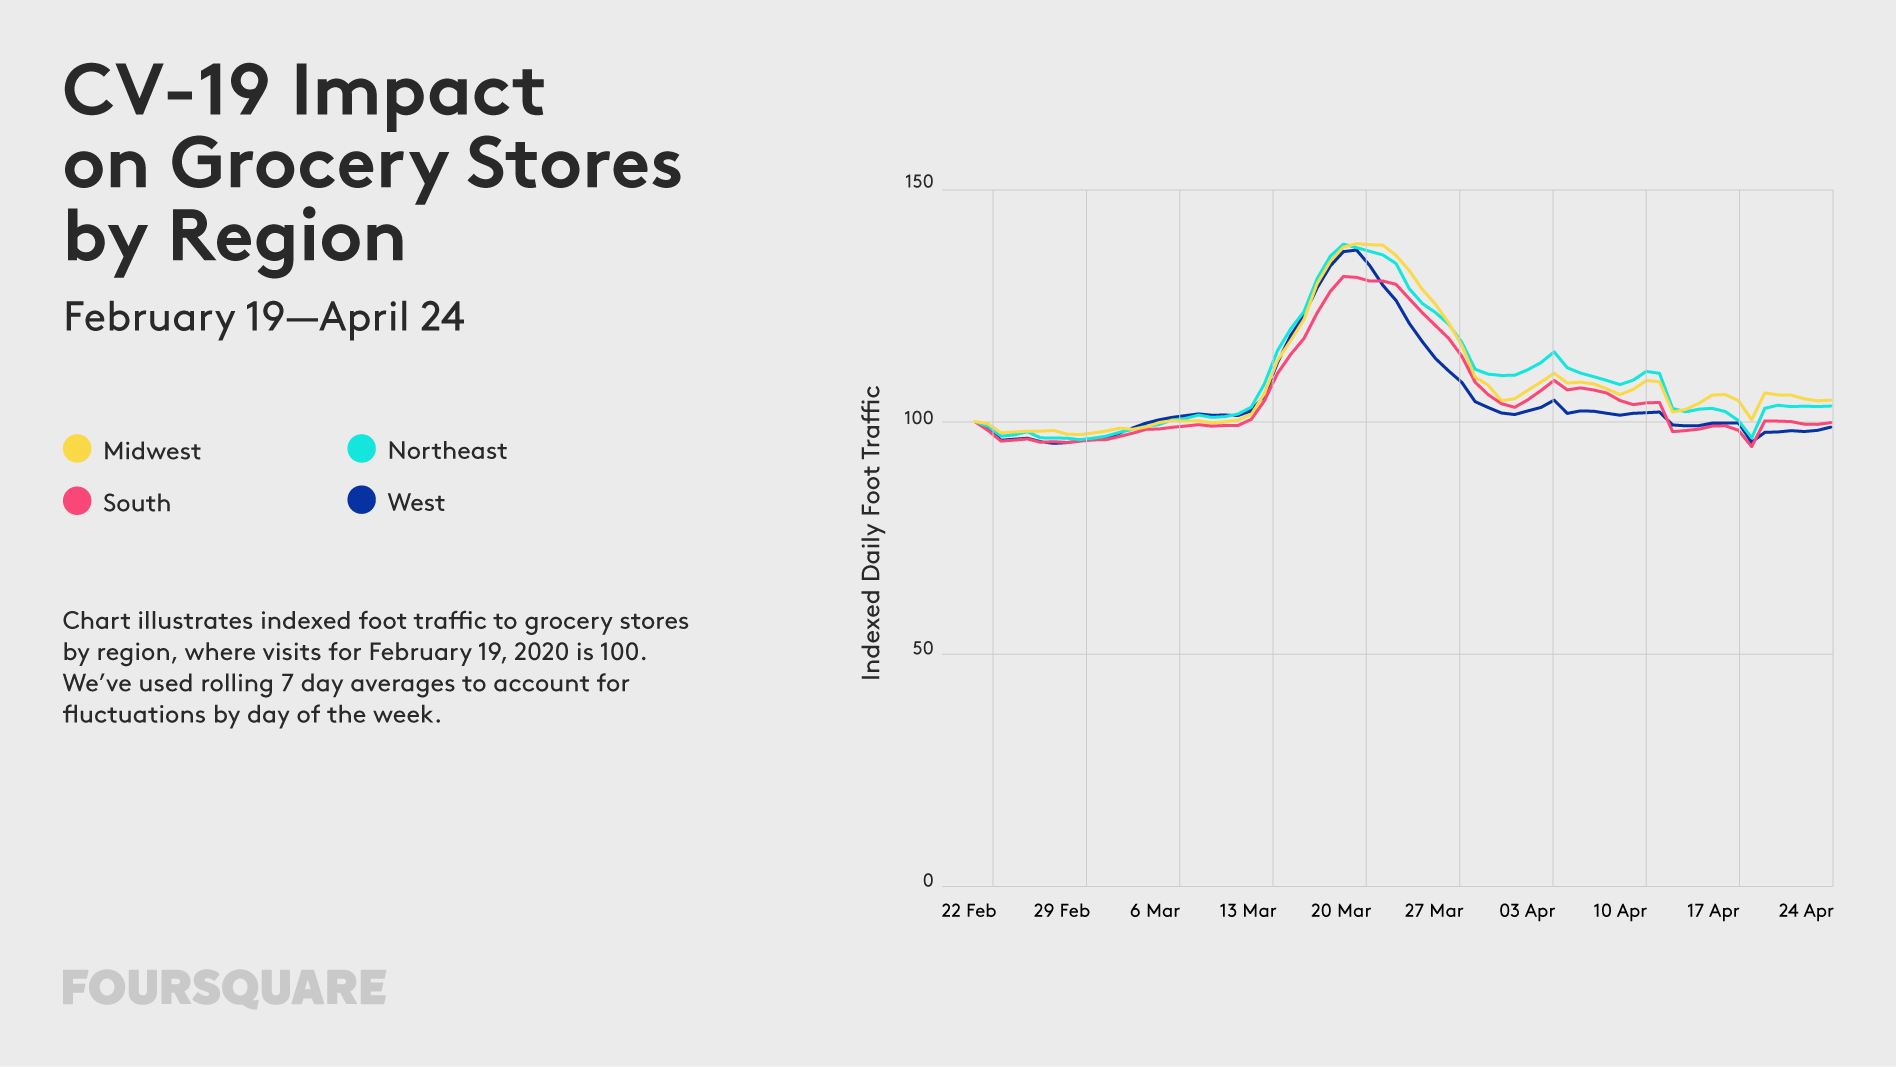
Grocery Stores: Surges in foot traffic to essential were observed in early to mid-March when consumers were in panic mode. This behavior settled down by March 23, as social distancing became the norm. Foot traffic has since returned to roughly normal levels.
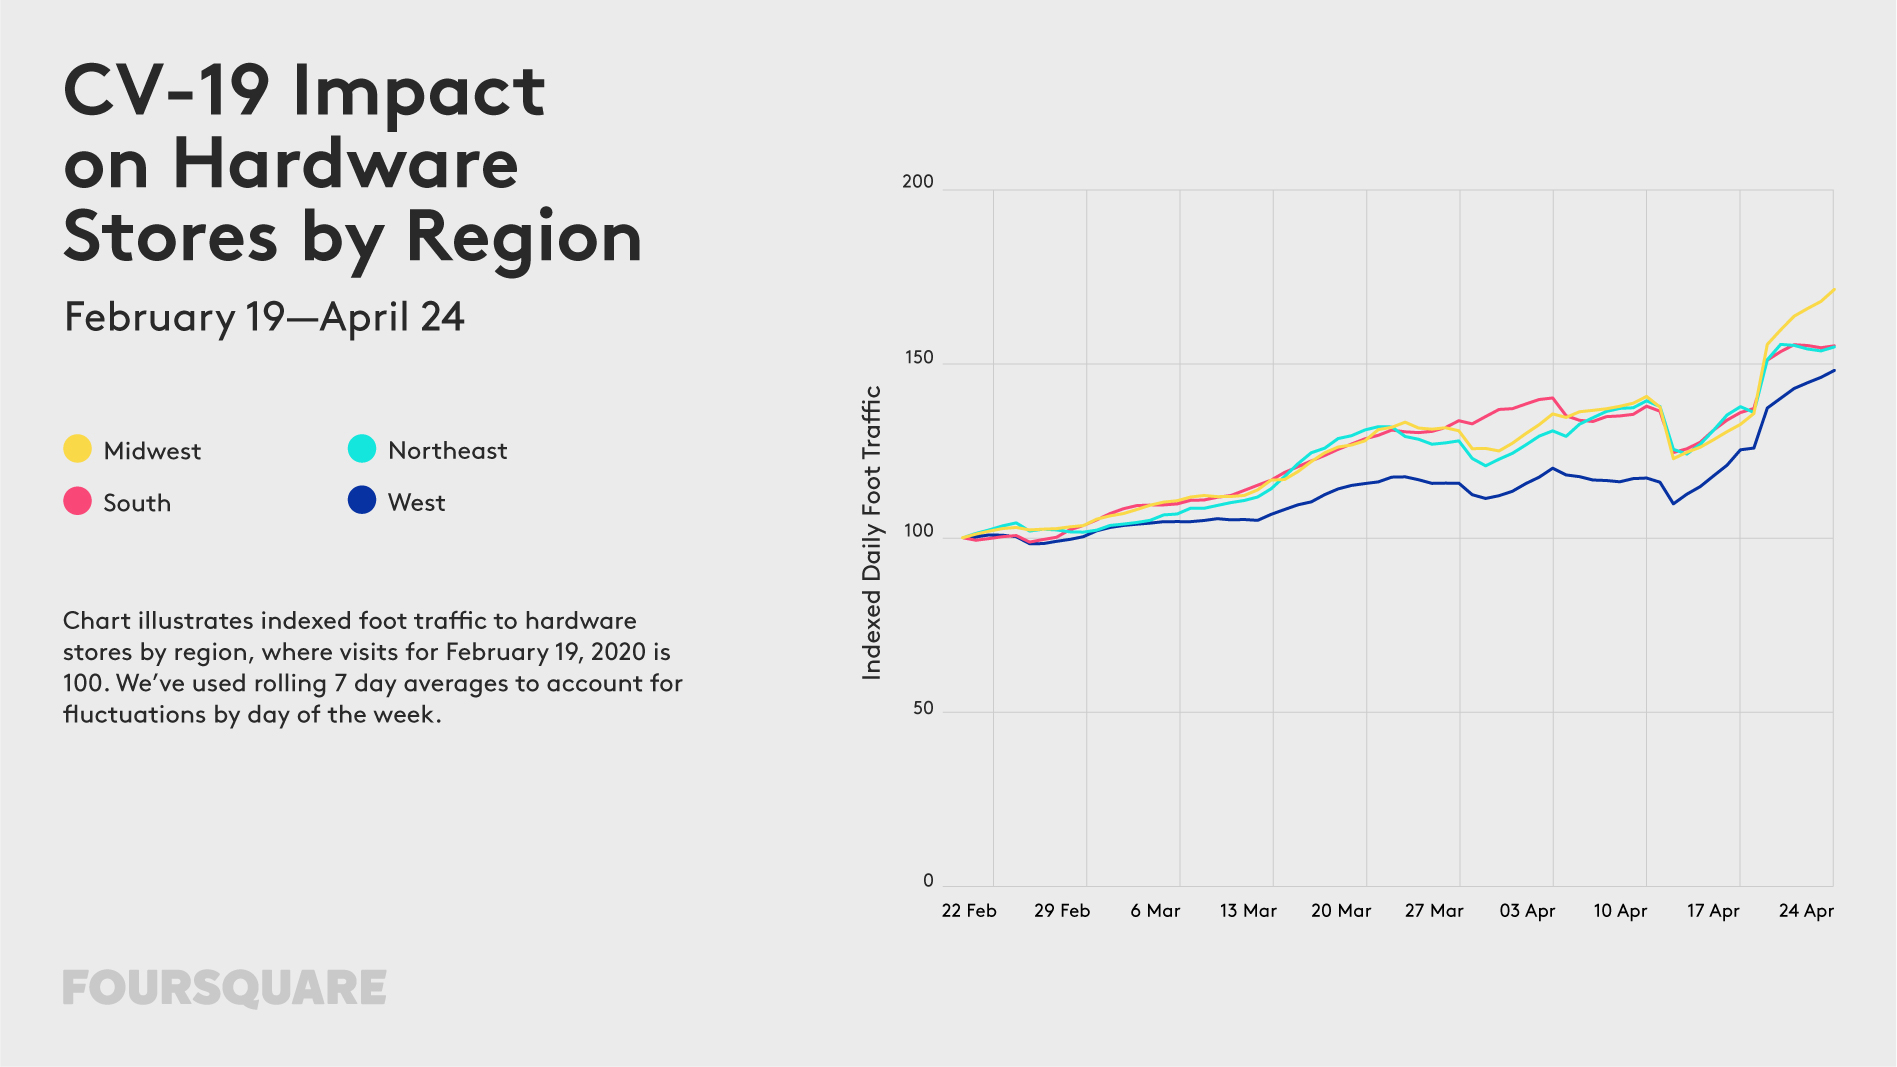
Hardware Stores: With people devoting more time and energy toward gardening and home improvement, foot traffic to hardware stores like The Home Depot and Lowe’s have increased significantly in recent weeks – with visits up 56% as of April 24.
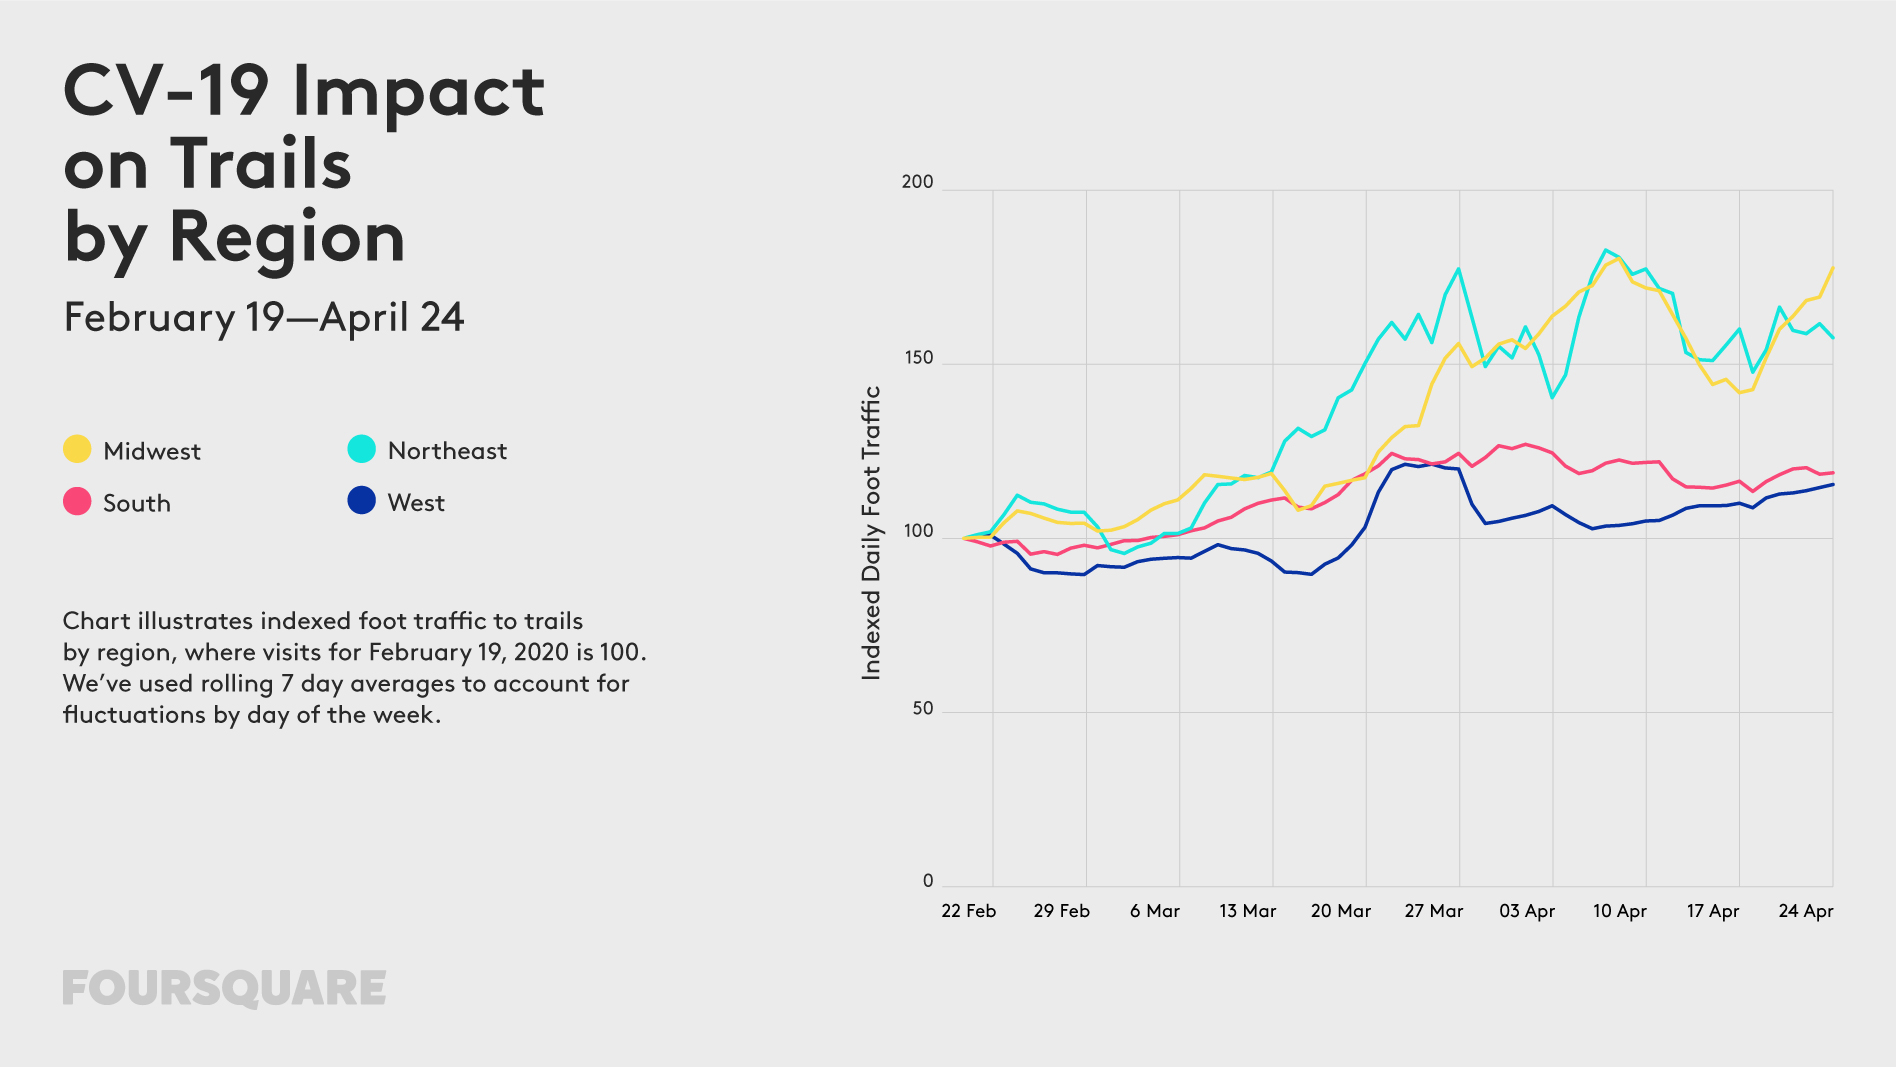
Hiking Trails: Trail traffic is up mostly in the Midwest (+77%) and Northeast (+57%). Although some of this could be due to seasonality, the growth in the last two weeks has been particularly notable.
Offices: Foot traffic may be increasing elsewhere, but visits to offices have remained roughly stable since around April 1, down 40% nationally from the week ending February 19 to the week ending April 24.