
Rocket launches are always exciting but tomorrow’s PSLV-C37 mission is probably the most exciting mission for someone following the developments in the commercial Earth Observation industry.
The Indian Space Organization (ISRO) will attempt to launch 104 satellites (which is a record in itself) during the PSLV-C37 (Polar Satellite Launch Vehicle) mission, including 88 “dove” nanosatellites belonging to Planet Labs and 8 Lemur-2 nanosatellites for Spire Global. Besides the nanosatellites, ISRO will also be launching Cartosat-2D, an 714kg Indian Earth Observation satellite with panchromatic and multi-spectral sensors on board. Cartosat-2D will have the same features and sensors as the earlier Cartosat-2 series satellites.
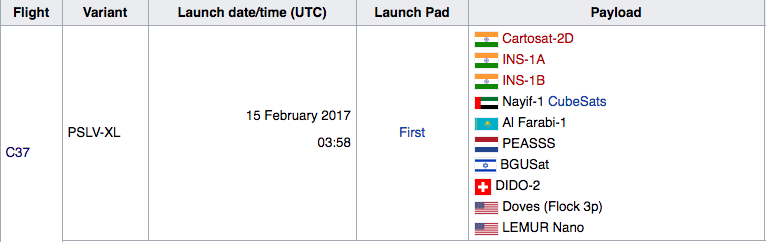
The list of satellites to be launched during the PSLV-C37 mission. Source: Wikipedia
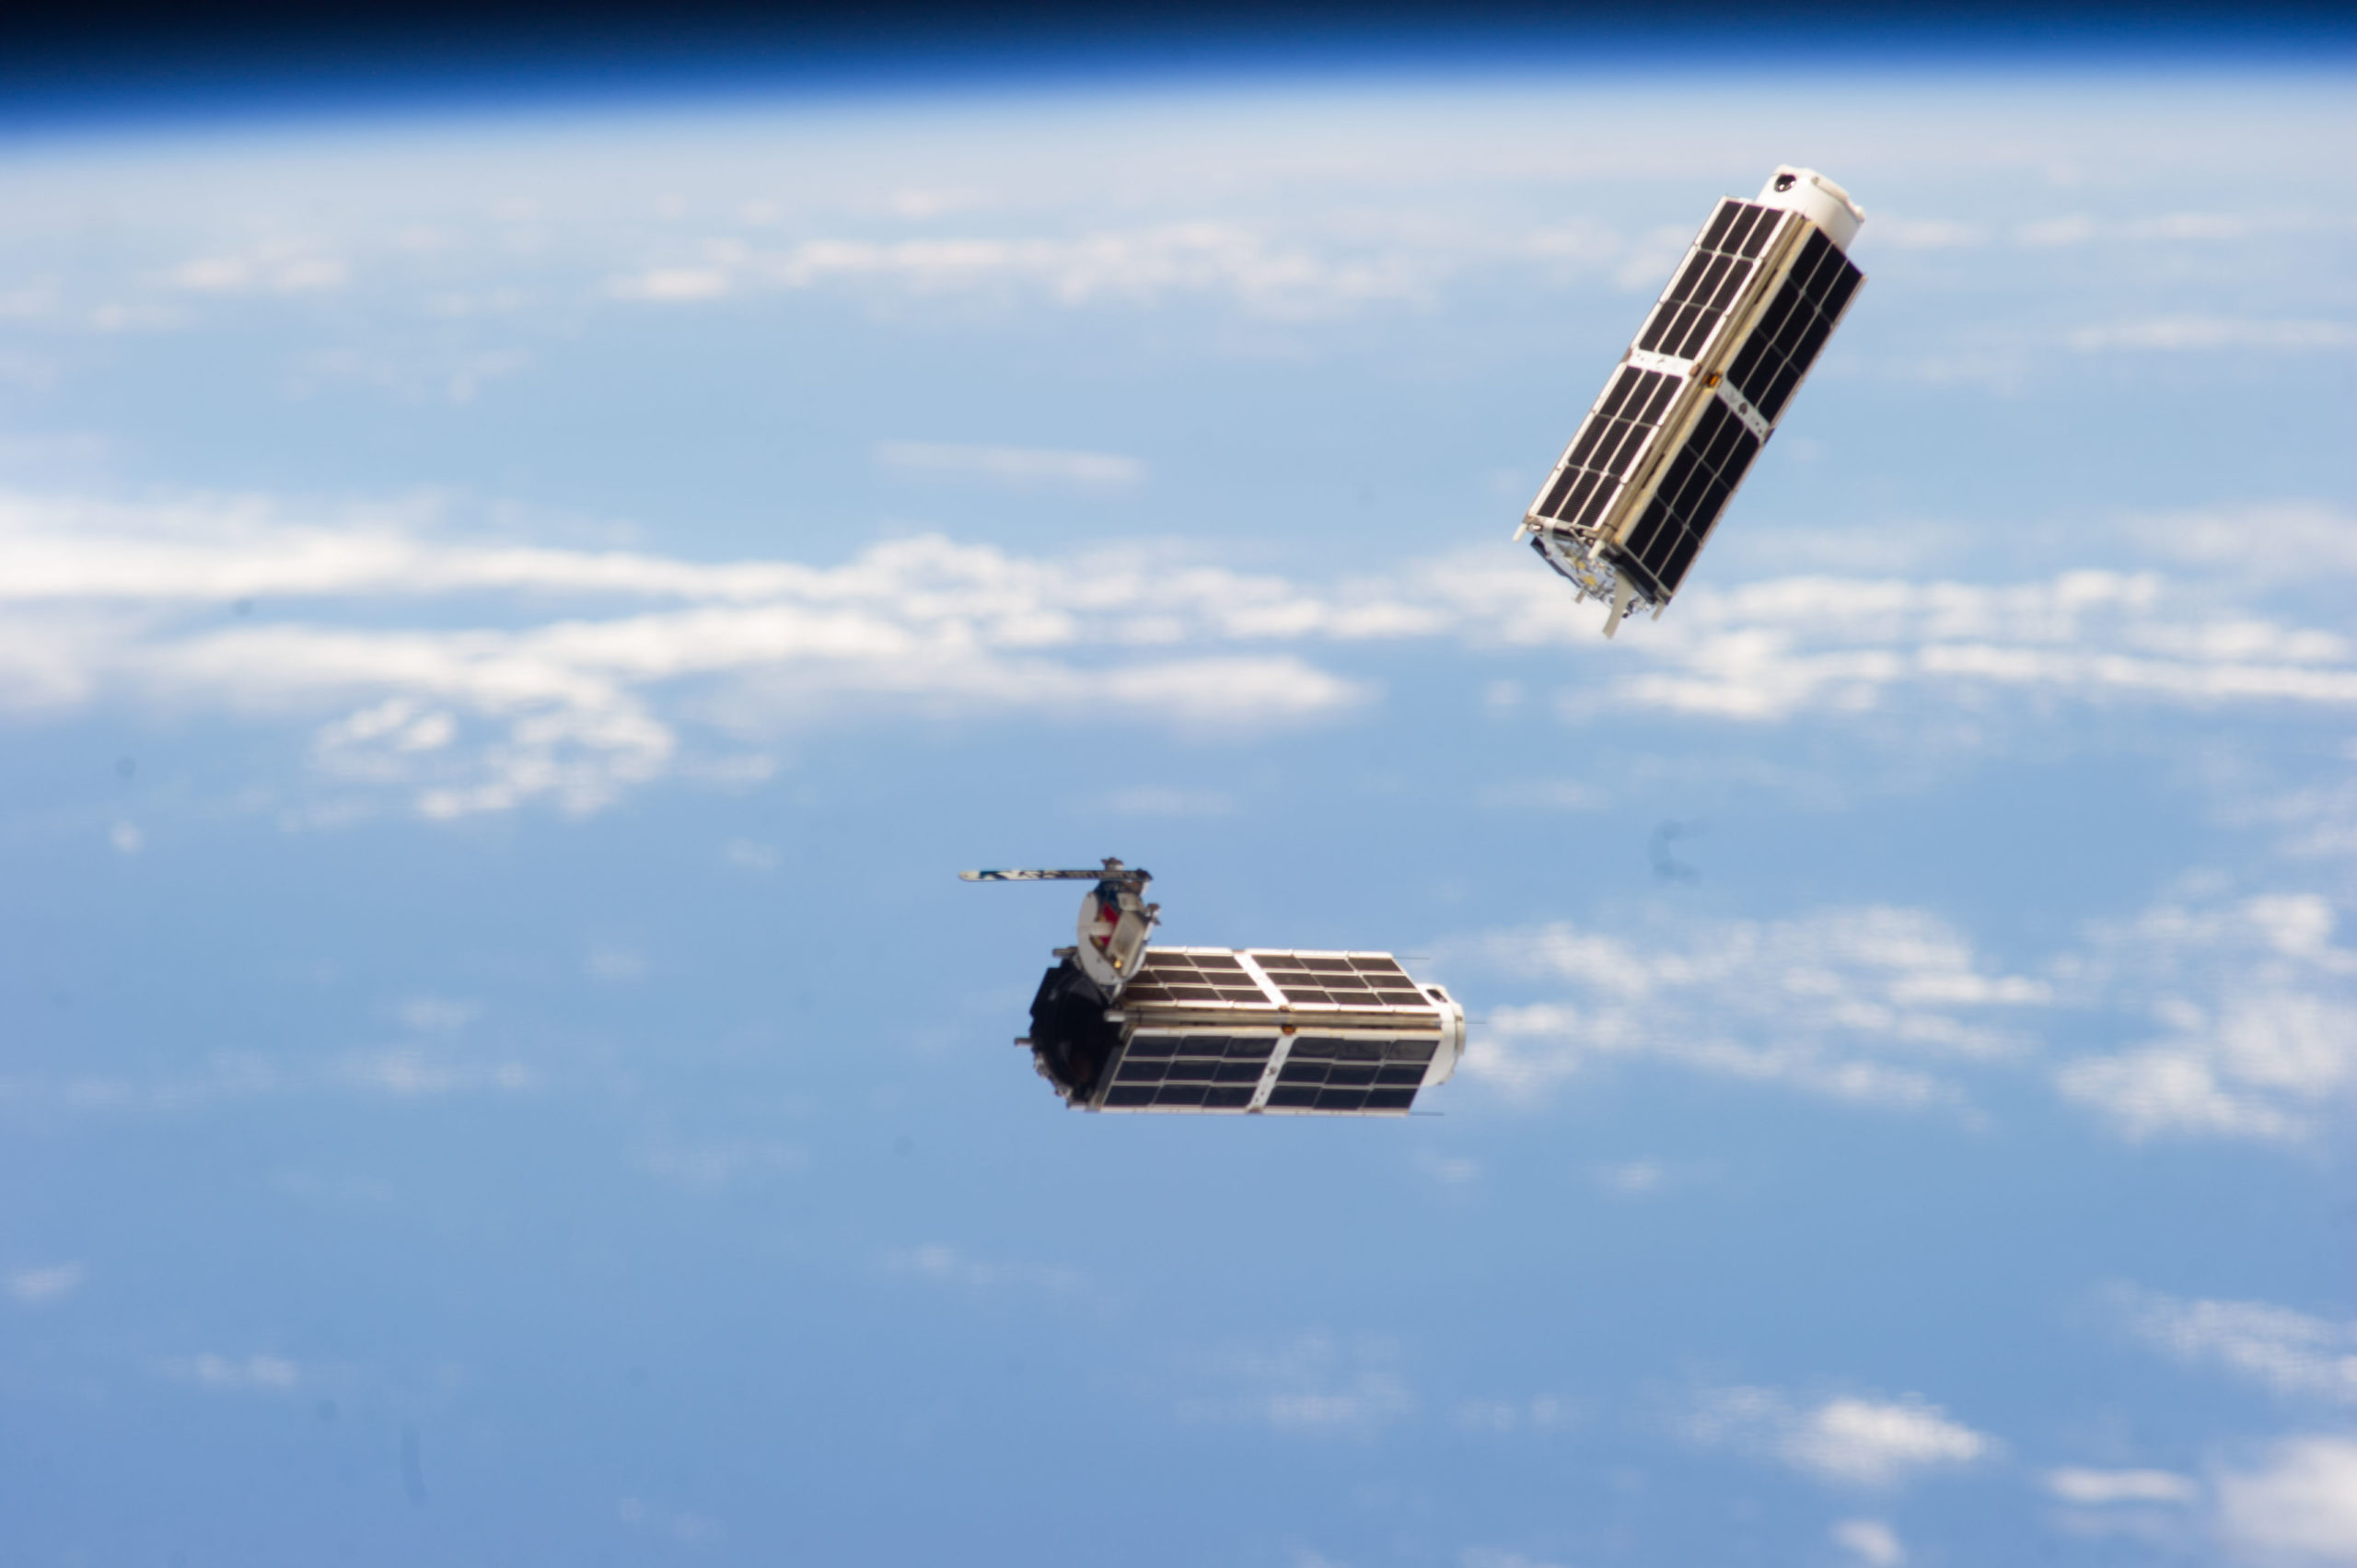
Planet’s Doves!
The 88 satellites onboard PSLV-C37 are the largest fleet of satellites to be launched in its history. Planet’s Dove satellites collectively known as “Flock 3p” will be put in a Sun Synchronous Orbit at an altitude of approximately 500km, joining the current 12
“Flock-2p” Dove satellites which are an in a similar orbit. Interestingly, the Flock-2p satellites were also launched by ISRO, earlier last year during the PSLV-C34 mission.
With this launch, Planet will officially have 100 Dove satellites imaging the Earth each day. February is indeed turning out to be an important month for the Earth Observation startup, who just a few days ago announced the acquisition of Terra Bella from Google (Read: Planet Labs acquired Google’s satellite imagery unit – Terra Bella).
With 97 Earth Observation satellites being launched as part of the PSLV-C37 launch, it is an important mission for the Earth Observation industry as a whole.


#


Next article

Year after year, somewhere on Earth, natural or manmade disasters cause loss of life and widespread destruction, frequently spawning refugee situations. Major disasters can temporarily make existing maps obsolete, rewriting river boundaries, shorelines, and land features in an instant. When disasters strike and decision makers need to understand new situations on the ground, the best source of information often comes from the sky. Satellites, like Landsat, can tell decision makers what damage disasters have done, providing timely insight into flood extents, fire boundaries, lava flow directions, road traversability, and oil slick movements.
Floods are one of the most destructive natural disasters, which normally result in adversely sizeable impacts to human and regional economy of affected areas. Due to the sudden occurrence and short-term duration of flood events; the exploitation of multitemporal data is of paramount importance in order to observe and monitor the extent of flood disasters.
Floodplain Mapping
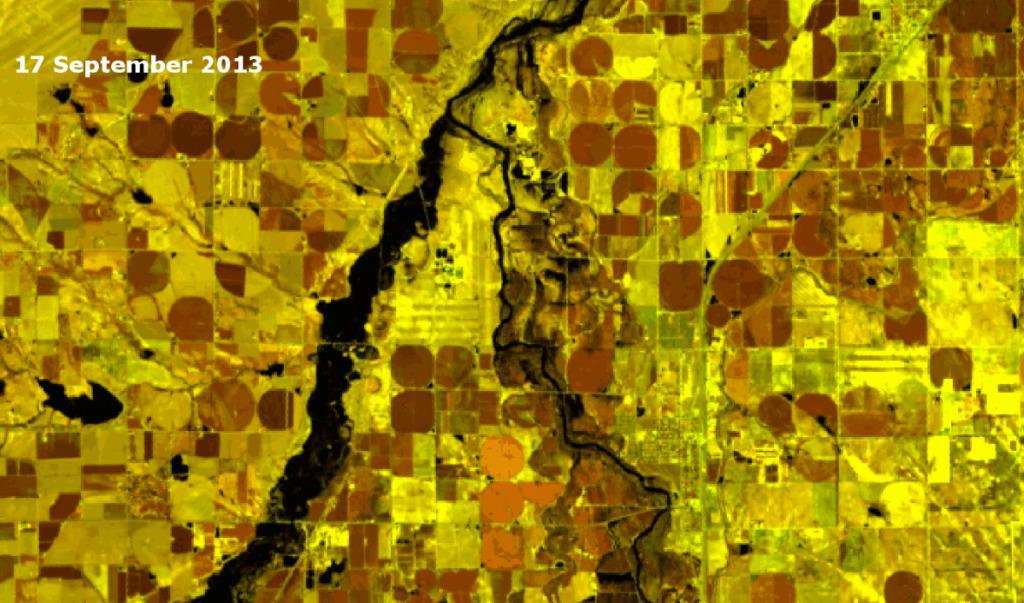
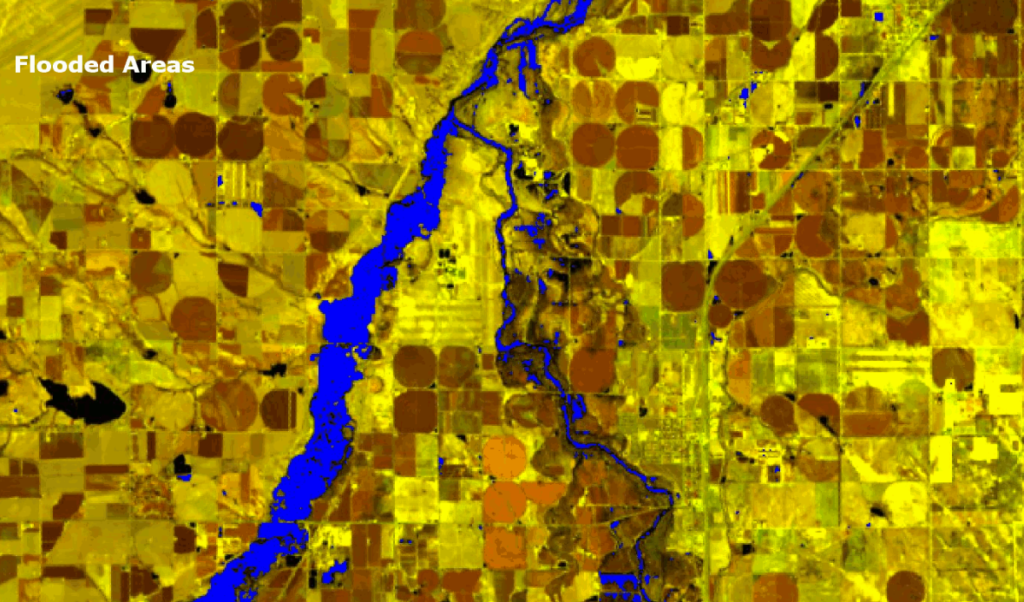
Landsat 8 imagery can easily contribute to the development of techniques for mapping flood extent and assessing flood damages through the combination of Remote Sensing and Geographical Information System (GIS) operations in order to improve the efficiency of flood disaster monitoring and management. Below you can browse an example of floodplain mapping (Colorado floods, 2013) using remote sensing products. More specifically, for the identification and classification of the flooded areas, a machine learning classification algorithm as well as an automated threshold algorithm for the Normalized Difference Water Index – NDWI (a satellite derived index from the Near Infrared and the Short Wave Infrared band) were implemented in order to automatically detect them.
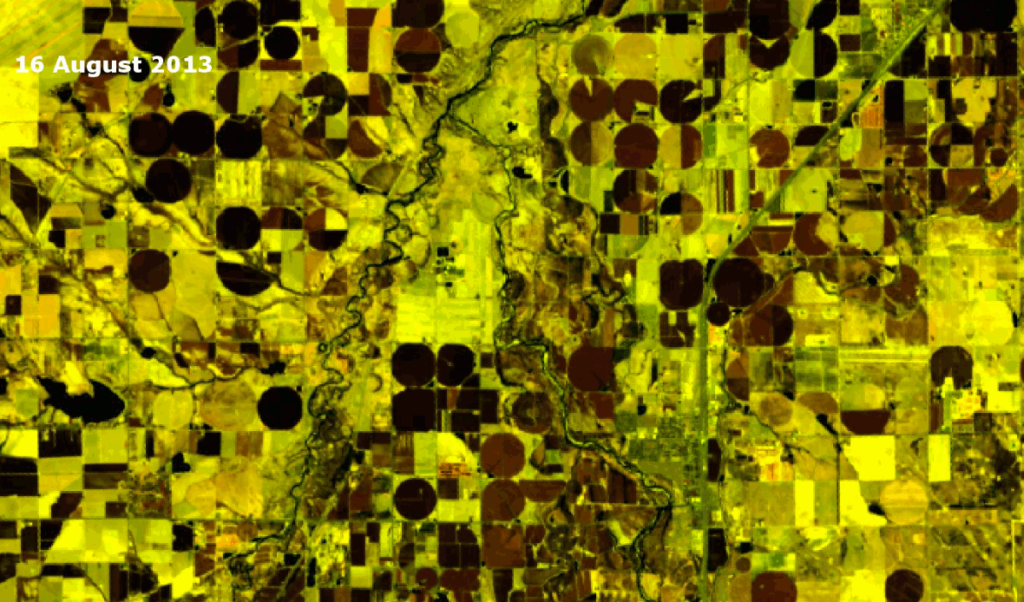
Before the flood event in Colorado, 2013
Forest Fires
On the other hand, forest fires are a major disaster as well since they destroy forest resources and deprecate the local ecological environment. In this framework, satellite remote sensing offers a useful tool for fire monitoring, management and damage assessment. Fire affected areas can be discriminated in a remote sensing image due to the strong contrast with the unburned areas.
Burn scar maps derived from remote sensing images provide information on the spatial extent and distribution of the fire affected areas and the total area burned. The burned area, together with land cover information, provide the basis for estimating emission of carbon dioxide and help decision makers to assess the post fire damage to the economy and environment. The example below illustrates fire assessment in Canada that has been implemented using remote sensing products. For this example, the Normalized Burned Ration Index – NBRI calculated from near-infrared and short wave-infrared spectral bands was used. More specifically, one NBRI image before the fire event and one after the fire event were respectively selected. The difference among these NBRI images highlights the burned areas and can be used to monitor the behavior of the ecosystem as the time passes.
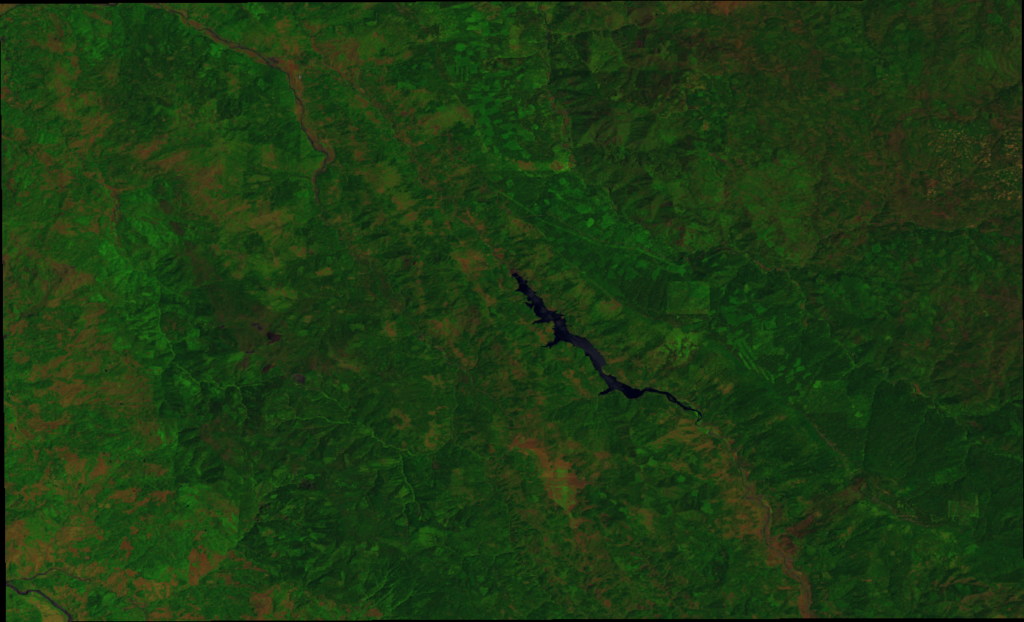
Before the fire event, Canada 2016
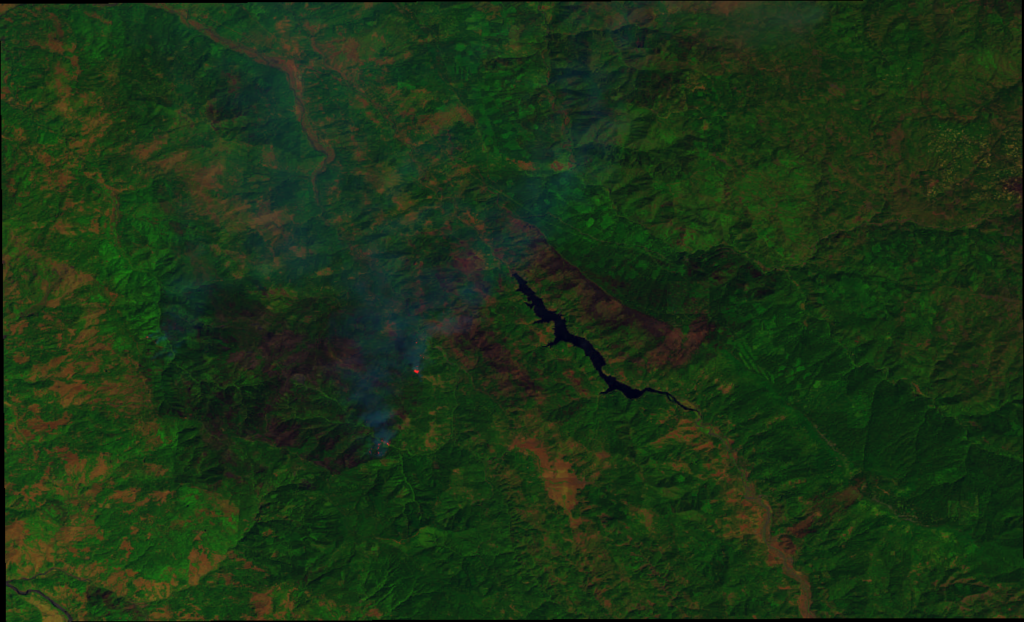
After the fire event, Canada 2016
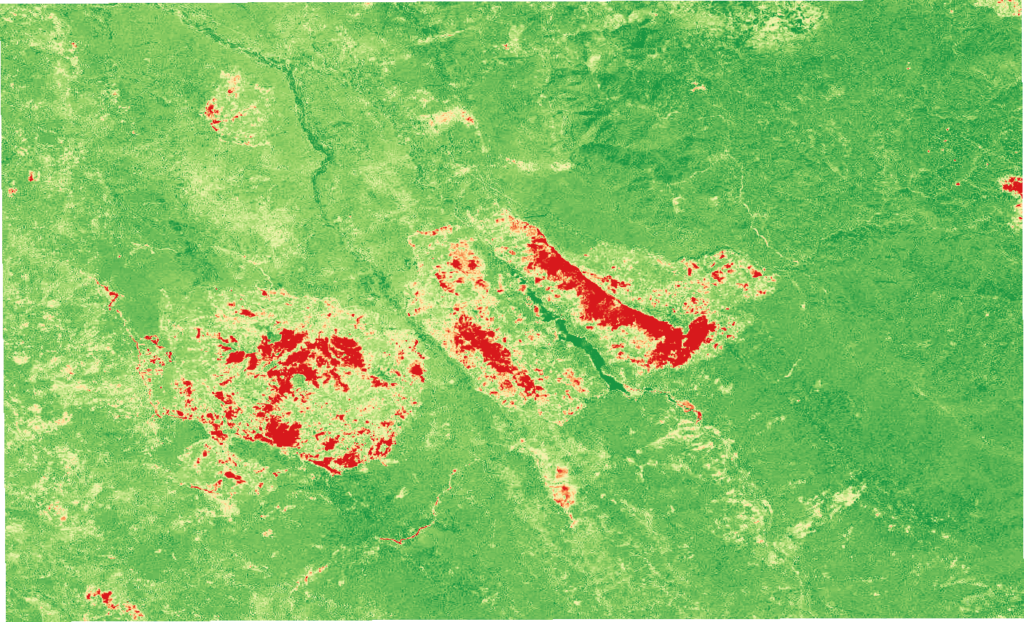
Fire assessment and burnt areas calculation, Canada 2016
Concluding, Landsat 8 imagery can significantly contribute in natural hazard assessment anywhere in the world. You can easily download and process Landsat 8 raw data from various platforms freely (like Earth Explorer by USGS, Amazon AWS, Google Earth Engine) in order to make your own maps. In addition, you can use online tools and platforms that offer ready-to-use, high-end remote sensing products and maps which you can download and use on your projects.
Some of them are:
- Spaceye by Spaceanalyzer
- Astrodigital Platform
- Planet Platform
- Satellite Search by Remote Pixel
- Uthercast Platform