
Every GeoGeek knows that Mercator projection lies. It has been created by the Flemish geographer and cartographer Gerardus Mercator in 1569 with the purpose to help sailors navigate. The idea behind it was that sailors don’t care about shapes of a land or metric distances, what is important is a course towards which they sail. In practice Mercator had to create a projection which would preserve angles (and by that means distort shapes and distances). Mercator decided to go for the easiest and the most useful solution, he created a map with perpendicular meridians and parallels, so that courses of ships would be represented on a map as straight lines.
But placing a globe on a flat surface always comes with a price. With this approach we get an easy to sail and navigate map but the map distortions increase with latitudes, as the north and south poles are at positive and negative infinity. In order to avoid infinitely tall map mapping services select an arbitrary cutoff point typically somewhere around 80 degrees.
Over the last 20 years Mercator projection has been brought to a global awareness by web mapping portals. There are a couple of reasons why they decided to go for that option. First of all the perpendicular grid of parallels and meridians is elegant and easy to use for programmers (it is easy to cut into smaller tiles). Mercator projection is also favorable to rich western countries as it makes northern countries look biggest than they actually are.
Mapzen a NY-based, open source mapping lab is also aware of it and decided to show that web mapping is not all about Mercator. They’ve used their Tangram engine which allows for crazy dynamic transformations of OpenStreetMap and show cased couple of unique map projection concepts. We can read on the project’s website:
“Tangram draws maps in real-time in your web browser, using a hotline to your graphics card called OpenGL. Small programs called “shaders” allow the position and coloring of anything onscreen to be modified instantly, according to your own design.”
First of all you need to be patient as it make take a minute or two to load all the maps below. The first one presents Albers projection which is an equal-area conic projection focused mainly on the US.
Another cool thing done using Tangram engine is 3D-2D transformation to from the globe to plain Mercator projection.
But the most impressive things are yet to come. Below you see the Inception-alike horizonless projection.
“This bendy map is a mix of two views of the same data: the top part of the map is a standard top-down web map view (plus 3D buildings), and the bottom part is a tilted view of the same scene.”
The last example showcased by Mapzen is visualization of New York on a globe. It wraps the city tiles into a sphere of constant size and trims away whatever is left over.
These are only experimental projection concepts and there are not quite ready to take over the dominant position of Mercator but it shows that a lot of awesome things can be done. Great job Mapzen!

#Business


Next article
Finnish start-up Maptionnaire revolutionizes questionnaires related to urban geography
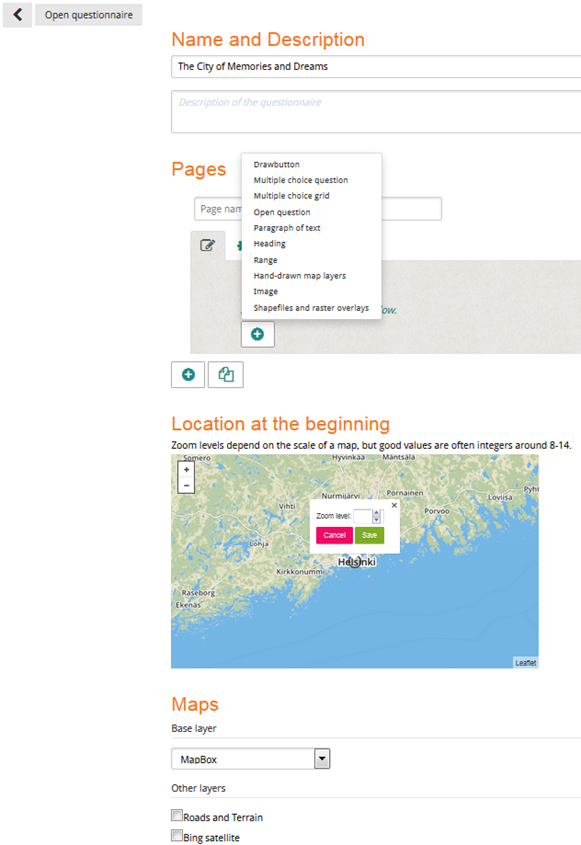
Maptionnaire – Editor view
Sometimes you hear about an idea so simple and yet so useful that you wish it was yours. That’s the case of Maptionnaire – a platform from a Finnish start-up for quick and easy creation of map-based questionnaires.
The tool is designed for urban planning and environmental organizations to get location-based insights from citizens but the platform can be used by anyone who has to ask the question “Where” to a community, neighborhood, customers, employees or any other group of people.
The idea for Maptionnaire came from a simple idea: “Why would you ask people location-related questions without using an actual map?”. You can try to do it in any other verbal way but a map is worth a 1000 words. Adding interaction to this equation you end up with a map questionnaire which easy to follow, intuitive and it gives the spatial answer which you are looking for. Anna Broberg – CEO of Maptionnaire told us:
“By using modern, efficient tools that citizens of today and tomorrow are willing to use, you could turn the residents’ activity and interest in their surroundings into tangible knowledge that can be used in making decisions about your city to move it into world-class. You can take control of the feedback of the residents and integrate their knowledge to your planning and decision-making systems to create a flourishing and livable city.”
Maptionnaire offers you not only the platform itself but also over 10 years of experience with gathering community data for public and research projects. The company behind the service, Mapita, is a spin-off from Aalto University’s Land Use Planning and Urban Studies research group in Finland. The aim of the group was to change public participation practices in urban planning and development and making local resident insight a more integral element in planning processes. They focused their research on finding ways to stimulate interaction between urban and environmental planners and citizens. All this knowledge and experience allowed for creation of a totally unique tool.
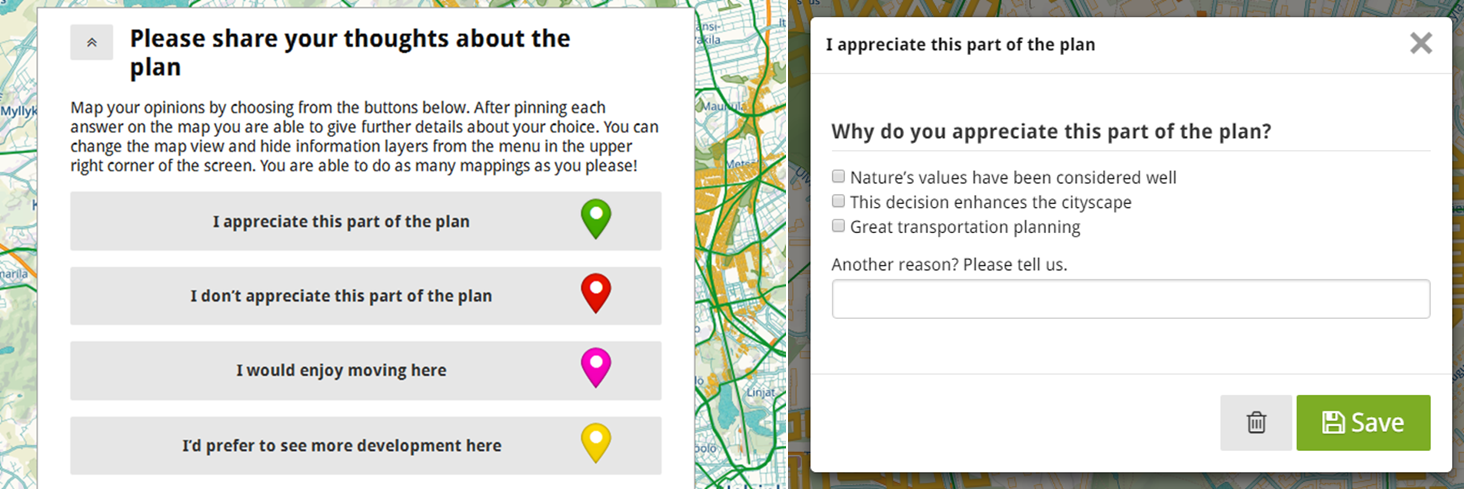
Maptionnaire – Respondents view
“We’ve developed a map-based system that allows building questionnaires and discussion forums that link the feedback and discussions to locations in your city. Our solution Maptionnaire not only crowd-sources the citizen insight, but enables you to analyze, publish and use this information to support your decision-making and citizen engagement. Location in the feedback elevates the value of the user input and enables efficient analyses and visualizations. Our customers around the globe are happy to use Maptionnaire in the cloud without costly installations.”
And indeed the tool is really easy to use. It allows you to ask predefined location-based and non-location related questions in just a couple of clicks. My favorite feature is an open question, where responders can draw on a map points, polygons or routes themselves in an easy way. This and other functions give you unlimited potential for capturing local insights from any community. The results or each questionnaire can be reviewed with Maptionnaire’s built-in analytical tool or exported to any other GIS service if needed.
It’s really cool and useful. Give it a try.
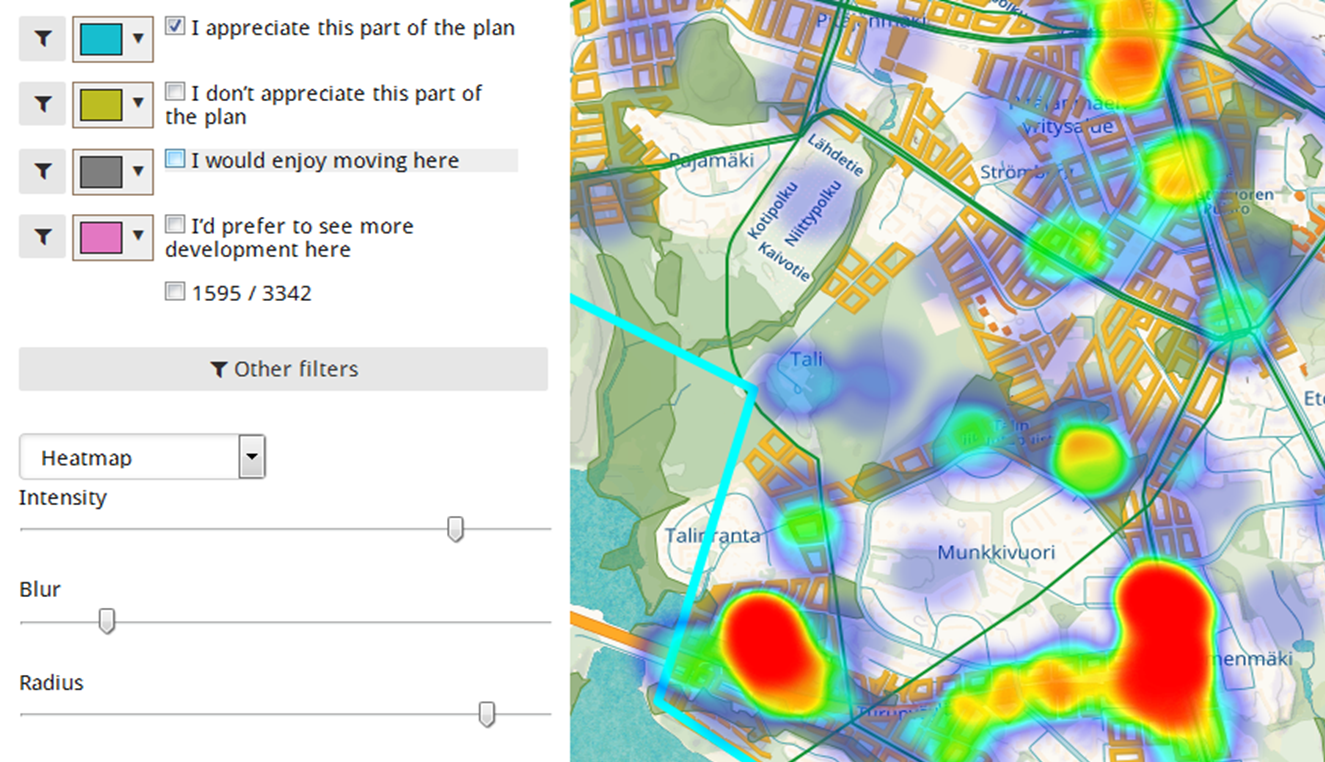
Maptionnaire – Analysis tool view