
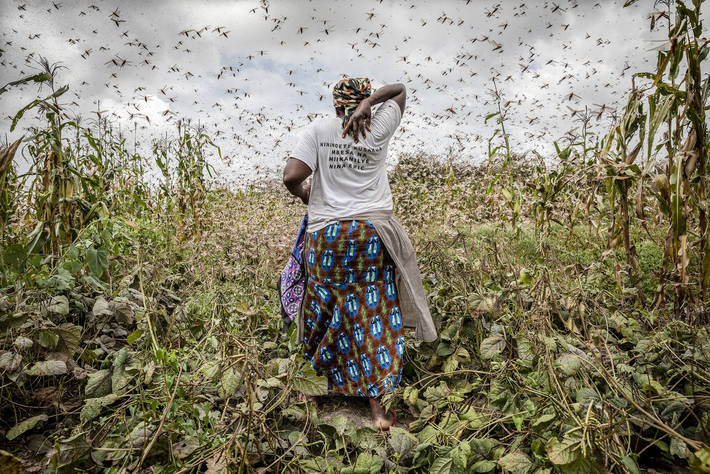
Courtesy: FAO
While the entire world grapples with the novel coronavirus, East Africa has been struggling to manage two devastating outbreaks. Billions of desert locusts, the most dangerous of its species, have been blasting through crop fields in eastern Africa for the last two months.
A small swarm of 40 million locusts – only about 1 sq km in size – can devour as much food as 35,000 people in a single day. This infestation is the worst the region has witnessed in decades. And yet, you may not have heard about it because coronavirus is dominating the news cycle.
Kenya has been inundated by the voracious insects since December 2019. By February, the swarms had spread to 10 other countries in eastern Africa, threatening food supplies for millions of people. Today, countries as far as Yemen, Iran, and Pakistan have been infested, bringing the worldwide tally to 23 countries and making the locust crisis increasingly global in nature. And things are likely to become worse in the coming months with the arrival of the rains.
Understanding the locust plague upsurge with satellites
There are two important environmental parameters for locust development: soil moisture and vegetation. Females almost always lay their eggs in wet, warm, sandy soil, and use the nearby vegetation to provide sustenance for maturing locusts. Swarming typically occurs when a period of drought is followed by good rains and rapid vegetation growth.
Therefore, by monitoring soil moisture and vegetation from space, researchers and relief organizations can better understand where locusts are likely to swarm. Using remote sensing observations to improve timely and accurate forecasting of locust plague, countries can act quickly to stop the outbreaks before they spread.
NASA-funded scientists have partnered with the Desert Locust Information System of the UN Food and Agriculture Organization (FAO) to learn more about locust behavior.
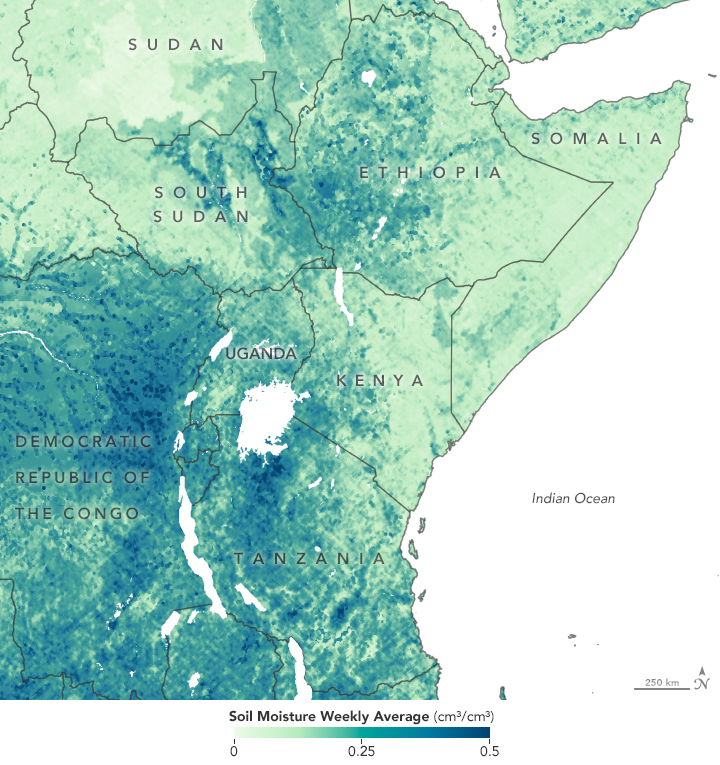
In the above map, you can see average soil moisture, as observed by NASA’s CYGNSS microsatellites, over eastern Africa for January 14-20, 2020, during the early stages of the current locust plague crisis.
“Our goal is to learn from FAO how to find out where the breeding grounds are,” says Lee Ellenburg, the food security and agriculture lead for SERVIR at NASA’s Marshall Space Flight Center. “If the prevailing conditions indicate that locusts will hatch and be taking off, the goal is to go early and destroy their nesting grounds.”
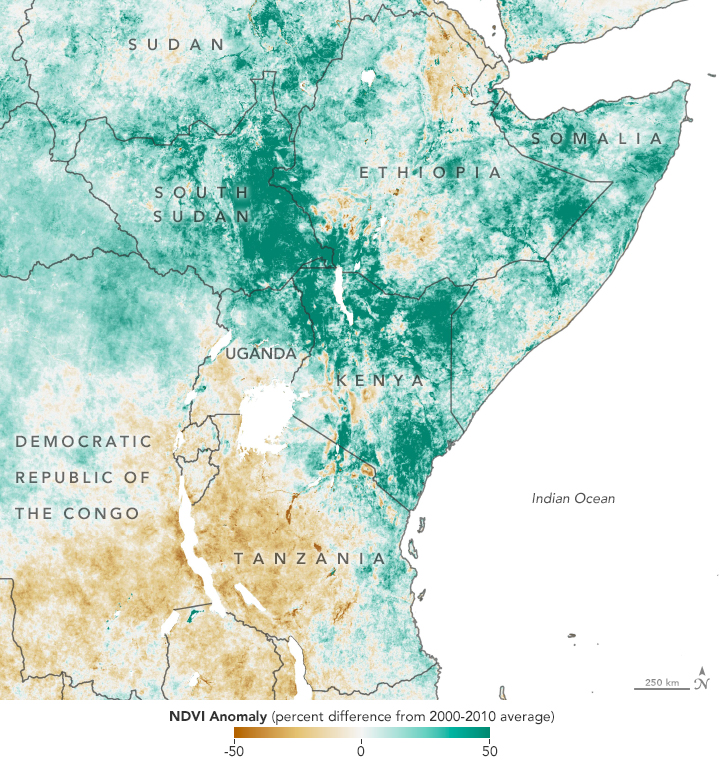
Here, the map shows changes in green vegetation across eastern Africa between Dec 15, 2019, and March 15, 2020. The Normalized Difference Vegetation Index (NDVI) is a measure of plant health. According to Catherine Nakalembe, a food security researcher with NASA, vegetation across the region is much greener than average years. In fact, it is the greenest vegetation observed by NASA’s Terra satellite since 2000 for a typical ‘December to March’ period.
Between October and December 2019, the Horn of Africa received up to four times more rainfall than average, making it one of the wettest ‘short rain seasons’ in four decades. The extra rain made for robust plant growth and bountiful conditions for locusts.
Now, the NASA team is refining several satellite datasets to assess the damage already caused and to create forecasts of where and how much longer locust outbreaks might occur. “We work in close coordination with national ministries through our regional partners, and we hope the outcomes from our ongoing work can ultimately support those who are in the front line of managing the current outbreak,” Nakalembe says.
Why the current locust situation got so bad?
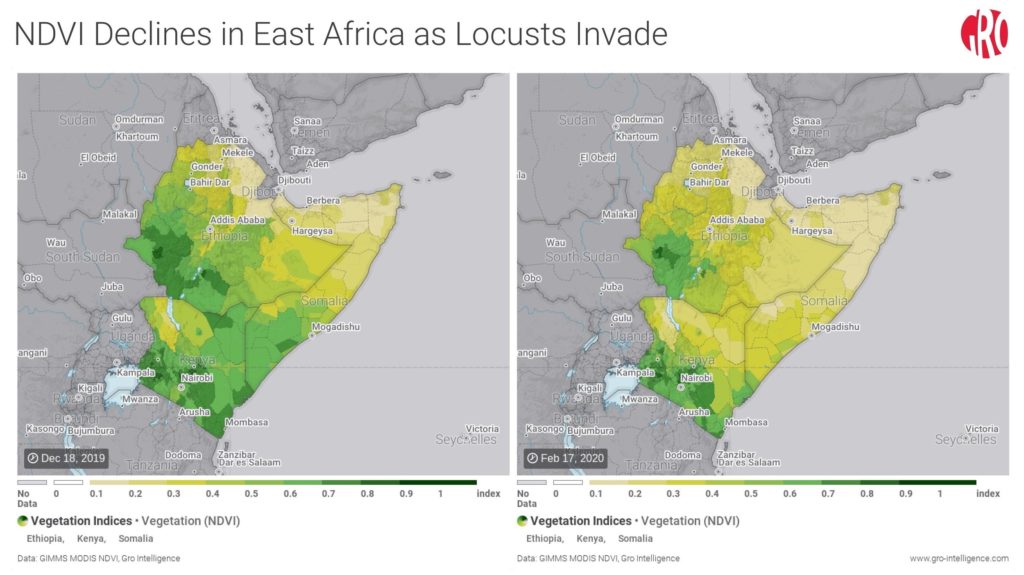
Global agriculture data analysis firm Gro Intelligence used satellite data to build the above side-by-side comparison, showing the extent to which crops in Ethiopia, Kenya, and Somalia have been depleted by locust swarms between mid-December and mid-February.
The restrictions imposed by many countries to contain the COVID-19 pandemic have created challenges in terms of the flow of personnel and equipment, but FAO has continued to work with governments, farmers, and agricultural producers to overcome hurdles. Admittedly, the efforts to nip the problem in the bud have been stymied by a lack of resources. FAO says its needs over $153 million to deal with the crisis, but is struggling to raise the funds.
If it wasn’t enough that conflict-racked places such as Somalia and Yemen make it particularly difficult to mobilize response teams for treatment with pesticides, COVID-19 has impacted the supply of pesticides and motorized sprayers both. The significant reduction in global air freight operations is further contributing to delays in deliveries.
The World Bank has warned that without broad-scale control measures to control the locust plague, damages and losses could reach $8.5 billion by the end of 2020.
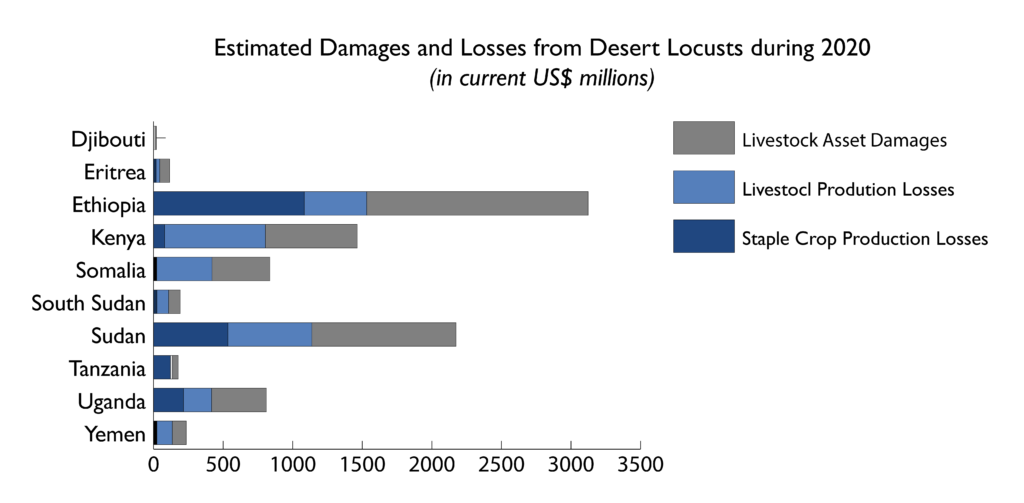
Chart: S. D’Alessandro/World Bank
“If countries don’t act now, the locust population will swell exponentially – they are projected to grow by up to 400 times their current numbers by June – and potentially spread to new areas, including West Africa, just as crops are ready to be harvested.”
If you enjoyed this article, read more and subscribe to our monthly newsletter!

#


Next article
There’s no denying that our planet looks absolutely stunning when wrapped in ‘night lights’ from human colonies, wildfires, oil wells, auroras, or even the reflection of the stars and the moon off the oceans and ice sheets. But the nighttime satellite images captured by earth-observing sensors serve a purpose beyond beauty. They are a testament of not just where we live, but how.
Suggested: Facebook creates interactive COVID-19 symptom tracking map
As China came to terms with the gravity of the COVID-19 pandemic outbreak with the dawn of the New Year, the government suspended air, road, and rail travel in the Hubei province and placed restrictions on other activities in the region in late January 2020. This pronounced change in human activity reflects clearly in the nighttime images captured by NASA’s satellites around the city of Wuhan, China, between January 19 and February 4, 2020.
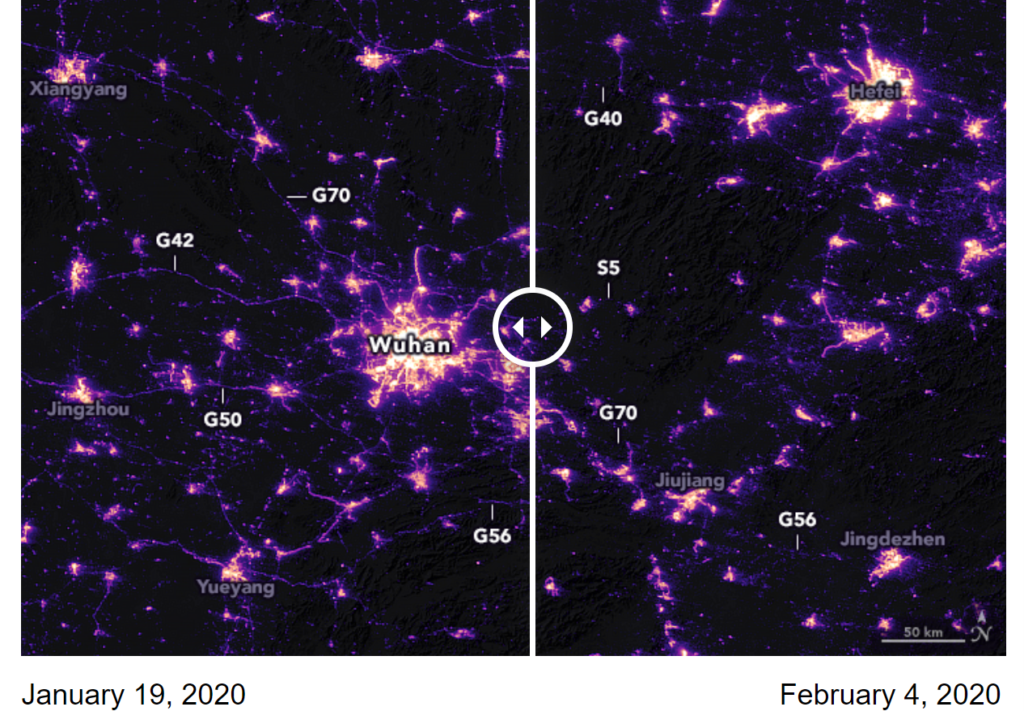
In the side-by-side comparison above, the labels marked with ‘G’ or ‘S’ indicate the highways with most prominent changes. For a more detailed view of the changes in nighttime lights, check out the satellite view of the Jianghan District, a commercial area of Wuhan, and nearby residential areas below:
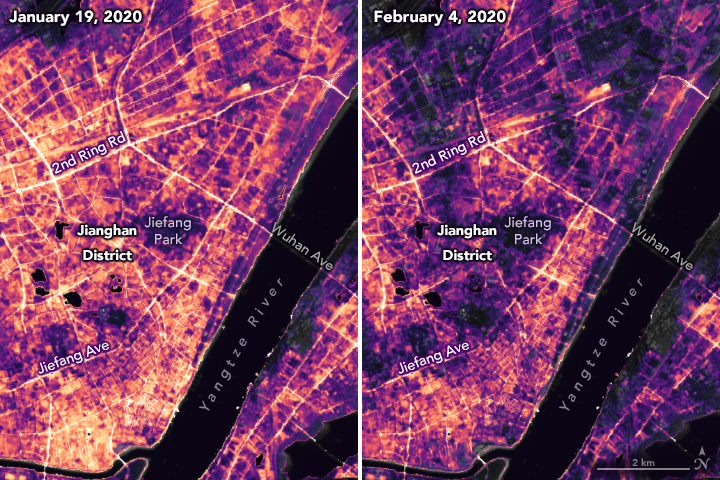
These image pairs were captured by the NOAA–NASA Suomi NPP satellite precisely from the same angle 16 nights apart – which is the satellite’s orbital pattern. The raw images were then calibrated to account for changes in moonlight, clouds, pollution, the landscape, atmosphere, and even the Moon phase.
Also see: Better air quality over China due to anti-corona actions
Precision is critical for studies with night lights and the last few years have seen NASA’s ‘Black Marble’ research team build tools and techniques to gather a better, more consistent signal from nighttime images. Miguel Román, a principal investigator of the team, says, “We have been studying cities around the world and how they grow and change. Are they becoming more or less sustainable and livable? How do they consume energy? When, where, and how do people move and why?”
Monitoring night lights gives scientists new insights not just about cities, their infrastructure development, and their growth patterns, but also about the pulse of human activities that make up urban life. After all, urbanization is not just about a place; it is a socioeconomic, demographic, and land-use phenomenon.
If you enjoyed this article about nighttime satellite images, read more and subscribe to our monthly newsletter!