
Google’s open source code has a new home – opensource.google.com. Open Source has been at the core of Google since its beginning, and the company is a big backer of open source projects.
With opensource.google.com all of Google’s Open Source contributions can be easily accessed in one location – including all the “Location & Maps” projects/libraries that Google has contributed to (24 as of 10th April 2017). Google even wrote a “How Google does open source” document, which is really interesting in its own right.
Google Earth Enterprise
Google Earth Enterprise is probably the most famous among the repositories that Google has open sourced in recent times. Earth Enterprise was deprecated back in 2015, but Google decided to open source it since many customers continue to use it actively.
Open Location Code
Interestingly, one of the projects that Google had Open-sourced is Open Location Code – a service that turns addresses into so-called “plus codes” that are easier to use than latitude and longitude for places where street addresses don’t exist or don’t work well. Ahem, isn’t that exactly what3words is for?
Marzipano
Marzipano is a cool media viewer that lets you incorporate 360° street-view like images for web browsers and mobile devices. The cool thing about Marzipano is that you can easily convert your panoramas into the street-view images that the demo below visualizes (Marzipano tool).
There are quite a few interesting projects in the open source projects including Cartographer in Google’s new Open Source homepage – take a look (Google Open Source).


#GeoDev
Next article


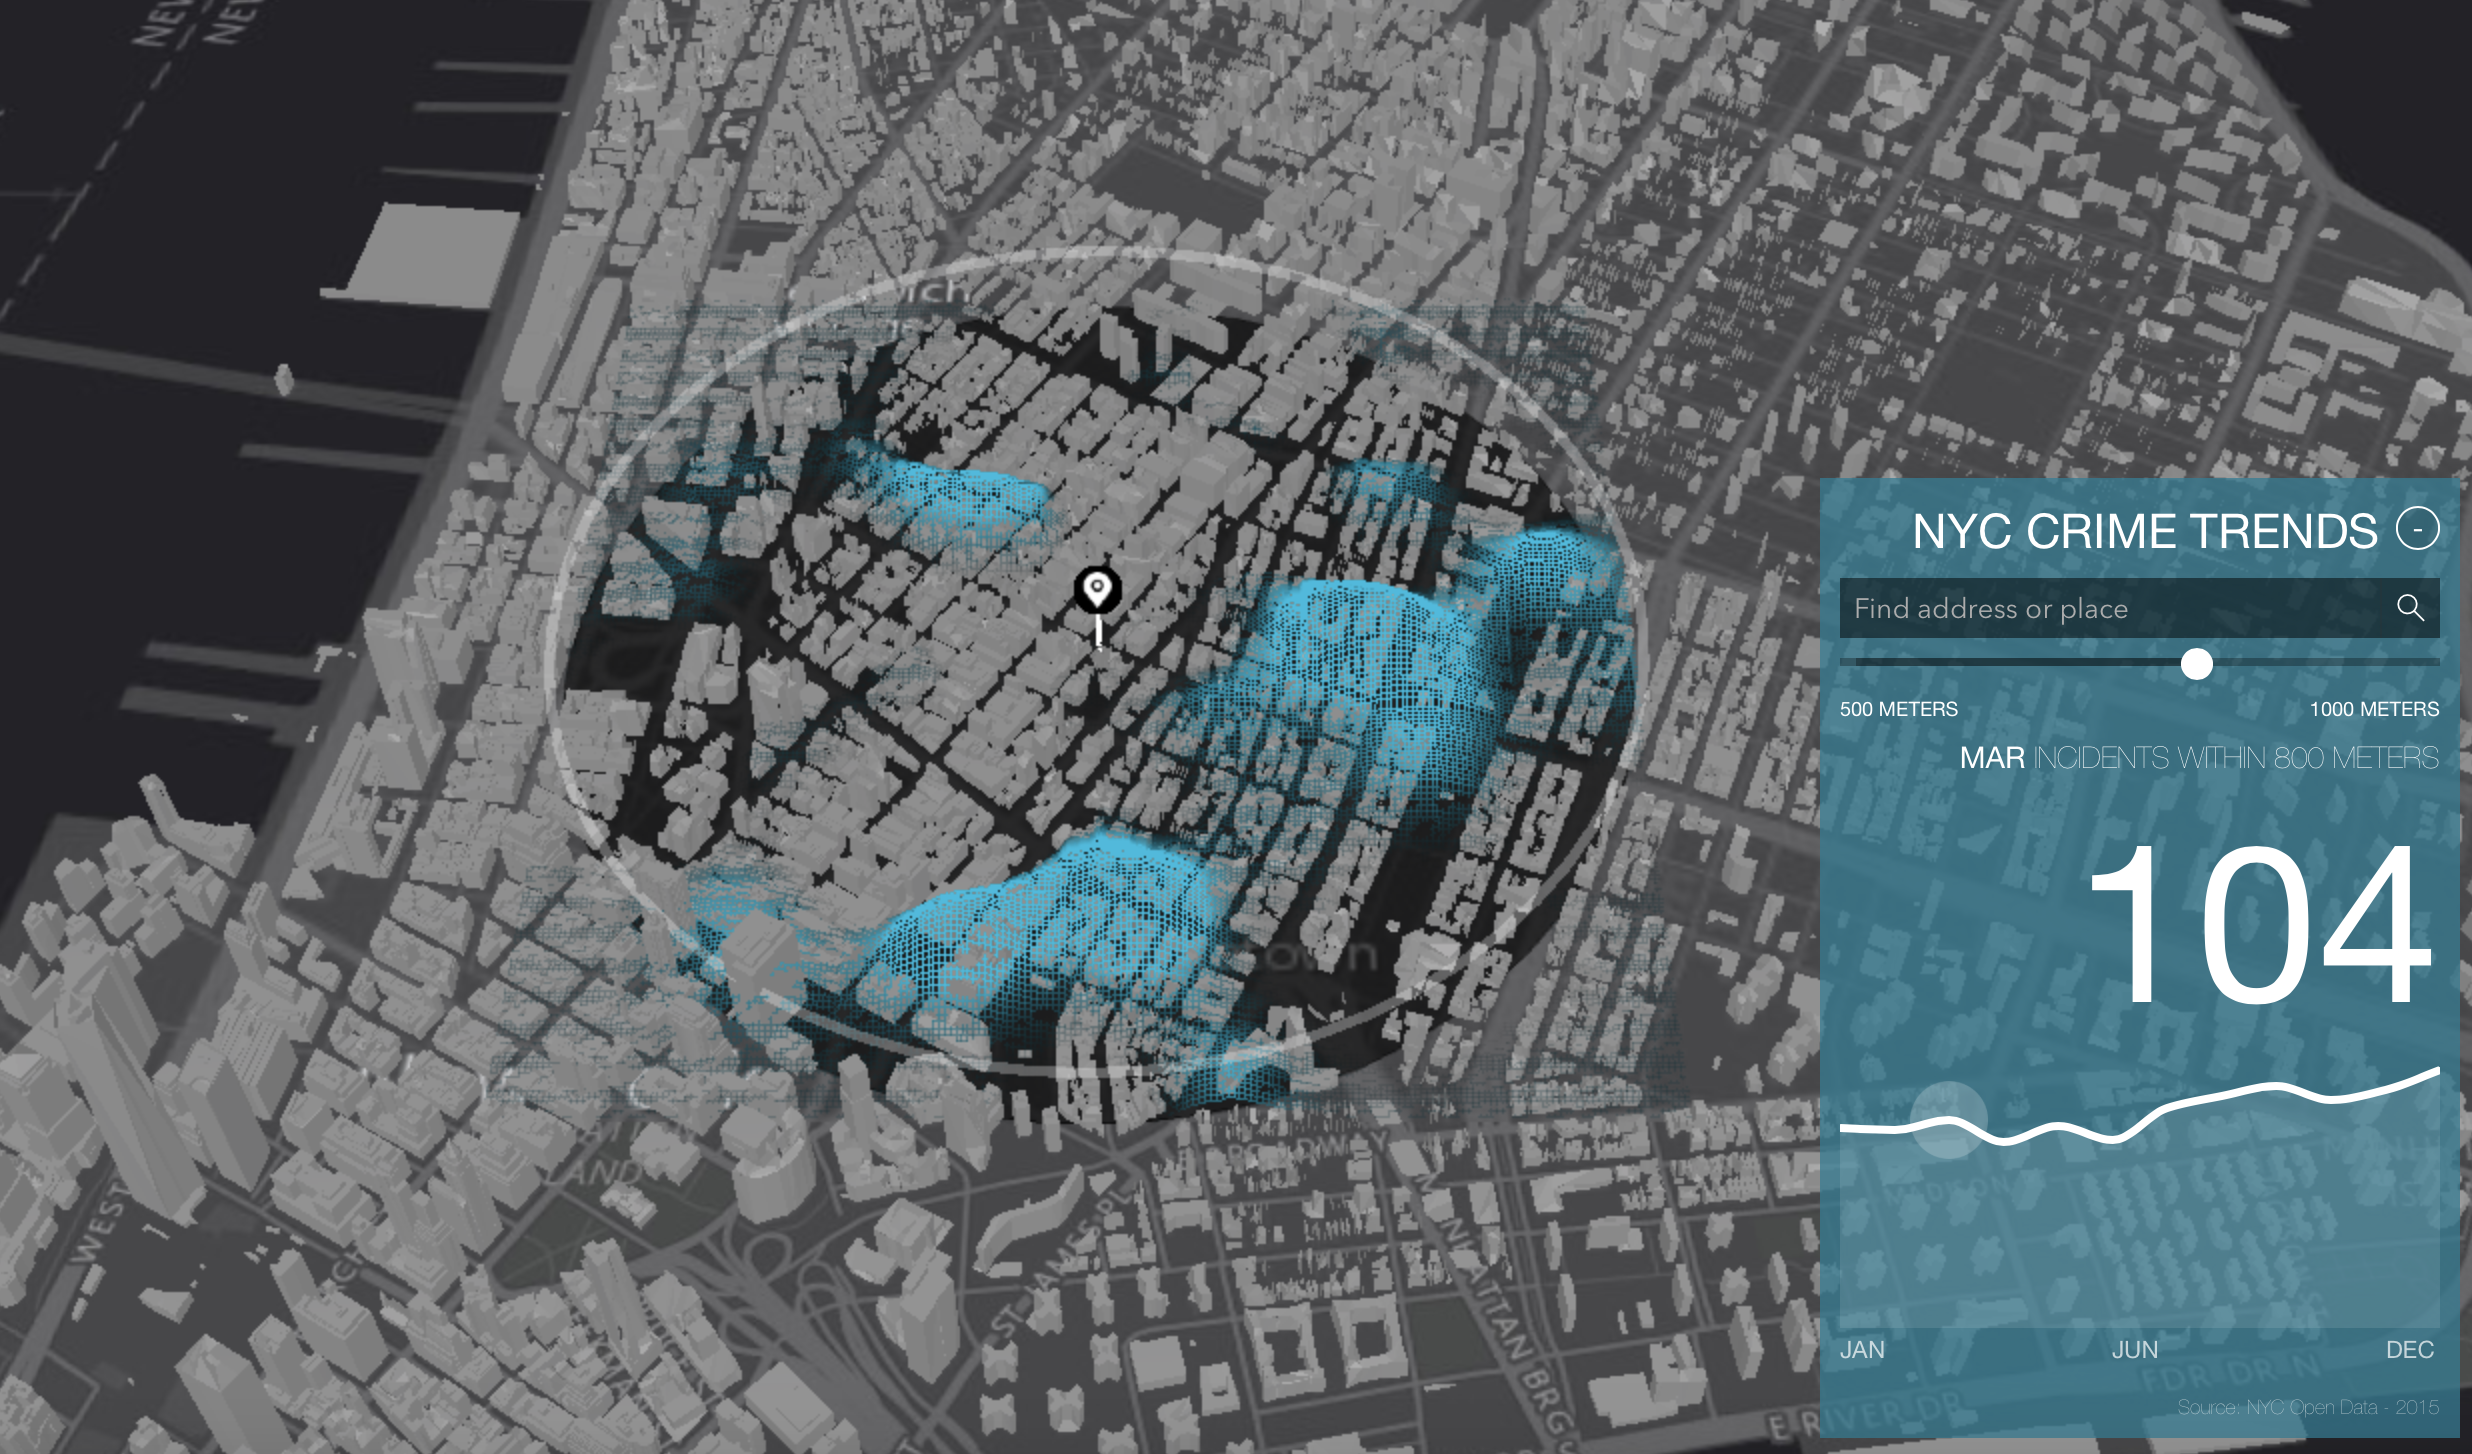
Over the years I’ve seen plenty of great mappings projects and it doesn’t often happen that I get surprised by a geo-visualization method and this unexpected map totally made my day.
The map created as a part of Esri Cool Maps initiative shows NYC crime data in time. That sort of task could be done with a regular heatmap and a timeline, but instead, the heatmap is elevated on the top of the 3D buildings layer. User can click on any point of the map and preview month-by-month data in the range between 500-1000m around selected location. The effect is amazing.
The map is clearly just a showcase of the Esri’s platform capabilities rather than a value adding project to study crime data. You cannot control the playback speed or fast forward to the next month, the scope is limited, and there is no legend to really understand and interpret it. Even with all these limitations I totally love the design of this map and I wish to see more visualizations of that kind