

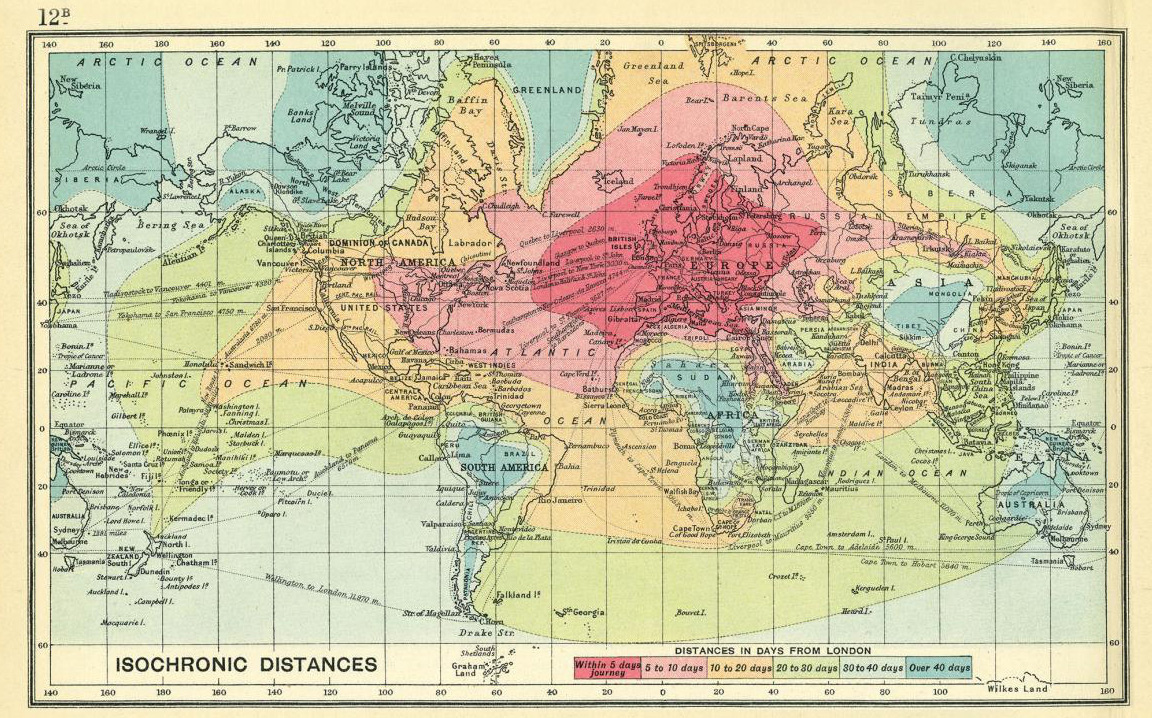
Click to enlarge
Recently I came across a really interesting map created by British cartographer John G. Bartholomew in 1914 and published as a part of “An Atlas of Economic Geography”. The map shows isochrones of travel from London to locations around the world. The isolines represent distances in days: up-to 5 day, 5-10 days, 10-20 days, 20-30 days, 30-40 days and over 40 days.
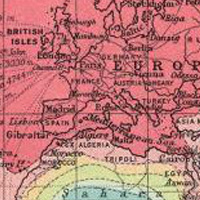 The map shows several interesting facts. First of all you could travel the whole Europe within less than 5 days. It is not surprising as before the First World War the railway in Europe has been already highly developed. You could travel from Paris to Vienna within 24h. 100 years ago it was almost the speed of light.
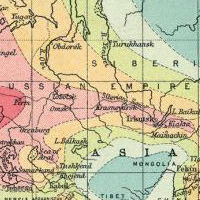 We can also observe an interesting time wrap in Siberia, where the Trans-Siberian Railway project was almost finished after it started 25 years earlier back in 1981. Interestingly if you would like to travel the remaining 120 miles (200km) from the railway to the borders of Mongolia, the journey would take you additional 20-30 days.
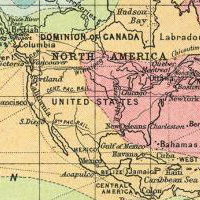 In the XIX/XX century the USA became much closer to Europe than ever before. When on the April 10th, 1912 the Titanic started its journey from Southampton it was supposed to reach New York only 6 days later. From New York you could midwest within 2-3 days and California in 6-7 days of train journey.
This map is something much more than just one of these old maps… It gives you an actual knowledge about how people used to live 100 years ago. Today within 24h you can get to almost any place on the planet. At the beginning of XX century journey from London to Australia would take you a month. The overcoming of space by the increase of travel speeds and the reduction of travel time made the world a much smaller place. The side effect of that change is globalisation that results in the expansion of the western cultural, economic, and political activities across the world…
Amazing map.

#Ideas


Next article

Begun in 1897, Boston marathon is always a special marathon event for the running community world-wide. It is held on Patriot’s day, the third Monday of April every year. We have also witnessed the terrifying bomb attacks and subsequent shoot-out during 117th annual Boston Marathon way back in 2013 which led to death-toll of 6 people and hundreds injured.
But this year on Monday, April 18th, 2016, Massachusetts authorities decided to turn to GIS technologies in order to manage the safety of the event. Boston city partnered with Esri in order to do the real-time tracking of the race route and key stations which are the most crucial aspects of the crisis management that enables authorities to take decisions quicker and more efficient.
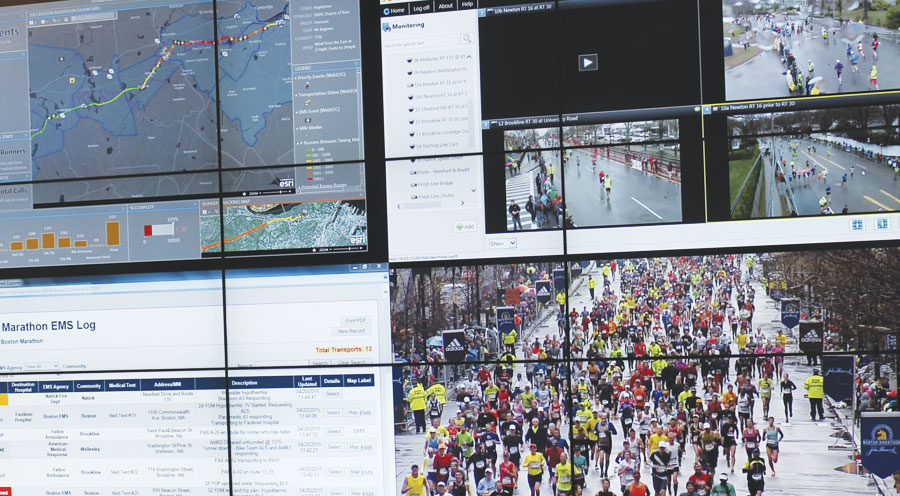
Boston Marathon Dashboard, courtesy the Massachusetts Emergency Management Agency.
Here’s how it works: a map of all 26.2 miles of the event shows the real-time movement of runners, live traffic and weather, the number of patients in medical tents, and even things like emergency vehicles and the helicopter landing pads. An estimated 200 people are logged in at any given time, broadcasting the statistics to groups of people from federal authorities in Washington D.C. to local law enforcement.
“This technology has advanced as attacks, like those in Boston, catalyzed more security needs among event planners”, said Desiree Kocis, GIS Coordinator at the Massachusetts Emergency Management Agency (MEMA).
“[In the past] technology has always forced us to compromise what we can do from an information sharing perspective,” said Christopher McIntosh, director of public safety industries at Esri. “But that’s no longer the case. The hard part is for the people to understand what’s possible, what they should share with each other, and that’s what’s taking time.”
Events like marathons, where the large crowds gather, need to be guided and informed, needs technology like GIS to comprehend the security levels and status and ensure safety of the people.
Here is another GIS tool, a story map, by Esri explaining 26 Boston Marathon facts.