
 In the era of smartphones and smart devices, navigation in urban areas still remains a gray area where position accuracies (of around 5m) can be frustrating and misleading. Certainly all of us have experienced being misled to take a wrong turn because of this urban canyon problem. It’s amazing how 5 meters can make such a difference!
Why is the accuracy so bad in urban areas?
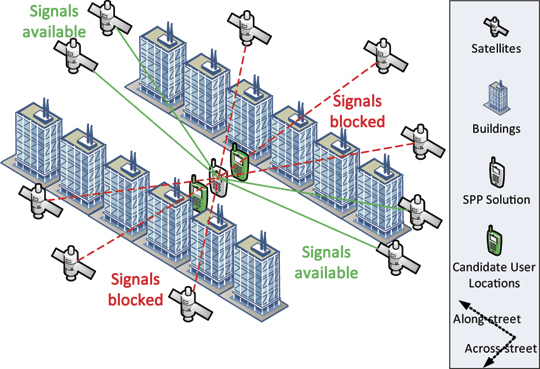
The reason for poor GNSS positioning accuracy is due to the lack of direct line-of-sight (LOS) signals from GNSS satellite constellations. Without direct signals, our smartphones and navigation devices are forced to use signals that have multipath in them. Despite many algorithms that totally neglect signals with multipath or use corrections, the accuracy is still not comparable to conditions where LOS signals are available. Although, Using GLONASS in addition to GPS does considerably enhance the availability of LOS signals it is still not going to solve the problem that arises due to signal geometry.
 We are surrounded by buildings that are parallel to the street, which means we are more likely to receive LOS signals from satellites that are along the satellite than across the street. This leads to position accuracy to be better along the street than across it. The end result is that, we will know accurately whether we are standing near door number 10 or 15 but we will have issues knowing whether it is the first street or the second.
How to solve this urban canyon problem in GNSS?
Well, we first need to accept the reality that so far we have not been able to come up with a better solution than GNSS to locate ourselves accurately on a global scale which means any solution that we think of, has to be able to take GNSS positioning as an input and better it; A solution that acts as a feedback loop mechanism rather than acting as a stand-alone solution.
Obviously we could then use INS (inertial navigation systems), iBeacons, WiFi signals, Mobile triangulation technique and maybe hundred other options but the technique that caught my attention – “GNSS Shadow Matching”! The GNSS Shadow Matching technique is currently being developed at the University College London by Dr. Groves and his team.
Improving GNSS positioning in urban canyons requires lateral thinking. If it’s not possible to calculate a sufficiently accurate position solution using the visible satellites, why not use the non visible satellites as well? This is exactly what shadow matching does. If you know where the buildings are and how big they are, you can deduce positional information from the knowledge that certain signals are blocked. – GPSWorld
The GNSS shadow matching technique makes use of 3D models of a city to accurately pinpoint your location. The principle behind shadow matching of GNSS signals is quite simple and straightforward, you know the building in front of which you are standing, thanks to 3D Building models and Image Processing. It is also possible to determine which satellites will have direct LOS to this building at any given point in time. We combine these two to determine our position with much better accuracy. Match the “shadow” signals with the actual signals that we are receiving and immediately our position accuracy is set to improve.
Quite Interesting right? Well, I cannot imagine using this technique tomorrow morning to navigate because of a couple of reasons, 3D models are not as widely available as much as we would like them to be. The drain on my poor smartphone battery if I have keep my camera turned on all the time. In conclusion, we still have to rely on using WiFi and Mobile Triangulation techniques to solve our urban navigation headache. However the GNSS Shadow Matching technique is still in its nascent stages and it would be foolish to write it off already. Who knows what the future holds in store 😉
If you want to read more about this interesting technique, here’s the link to the complete research article that also featured on the INSIDEGNSS magazine.


#

Next article

Clouds are a wonderful thing as they bring precipitation and make our planet lush and liveable. On the other hand, if we are interested in details on the Earth’s surface rather than the atmosphere clouds are bothersome obstacles. For my study on drought, for instance, I used MODIS imagery and had to get rid of clouds as those pixels represent highly unreliable values.
In the map at the bottom derived from MODIS images of NASA’s Aqua and Terra satellites you can see that global cloud cover is extensive. Particularly the intertropical convergence zone around the equator is marked by high convection and energy fluxes resulting in persistent cloudy conditions and only some weeks of clear sky during a year. What I find interesting here is that the areas around the poles apart from the white surface appear very cloudy. We have to take into consideration that the projection extends the poles endlessly enlarging the poles to a huge cloudy area. However, cloudy maps are not useful if the desired object of interest is the Earth’s surface.
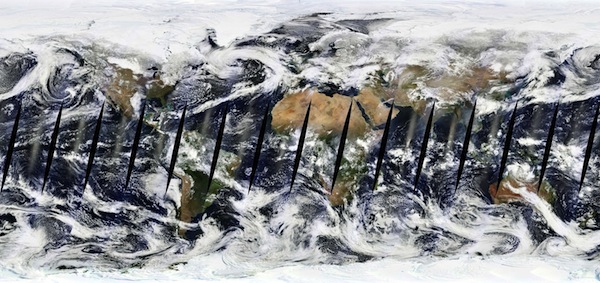
MODIS Terra composite for March 28th, 2013. Images: NASA LANCE-MODIS, courtesy of MapBox.
Cloud-free Maps
In order to obtain de-clouded maps until now for each region the clearest days were selected manually or automatically out of a large set of satellite imagery and stitched together. This process leaves seams where two image clash as they often come from different seasons. Also, on the global MODIS map sun-glint around the equator and no data areas (appearing as black holes) produce unwanted effects.
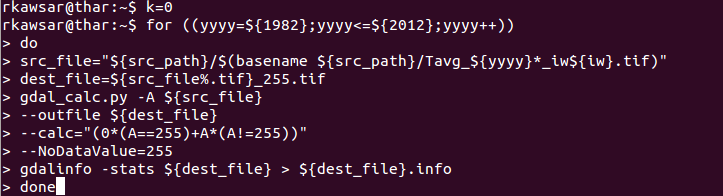
Specialists at MapBox have come up with a new method of eliminating clouds in satellite images. They used MODIS data captured between January 01 2011 and December 31 2012 (two terabites of data, remember that MODIS is installed onboard of NASA’s Terra and Aqua satellites that have been circling the globe twice a day for more than two decades producing a wealth of satellite data). They developed code for looking at the individual pixels and not whole regions, in order to extract the clearest days pixel wise. Those clearest pixels were averaged and finally used for the world map.
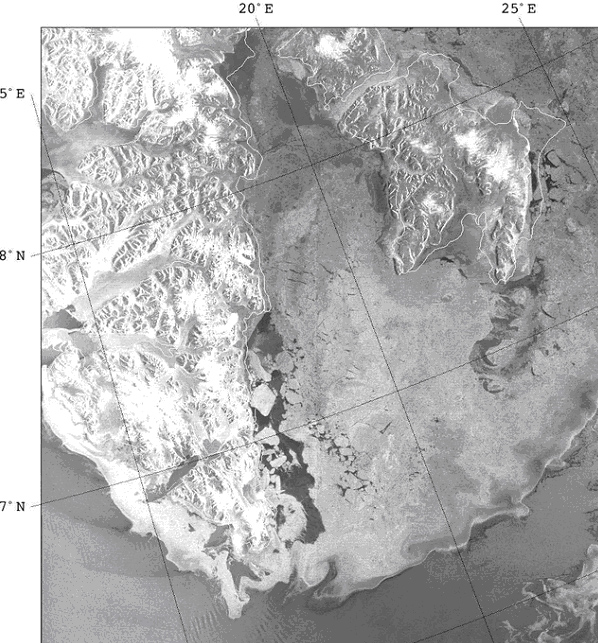
At the bottom I picked some ‘difficult’ areas to show the results of the de-clouding process. So far, the ‘cleaned’ world map is available for MODIS data. I think it would be great future work (for MapBox?) to apply that algorithm also to other satellites.
The image at the top shows a detail of Ecuador and north Peru. Close to the pacific coastline you can see the plains along the Pacific including the Ecuadorian city of Guayaquil. Immediately to the right of it lies the main ridgeline of the northern Andes, with the highest mountains on the eastern side of the range still peaked in snow. On the right hand the tropical rainforest in the Amazonian Basin appears lush green. A typical day in the Andes and Amazonian Basin, though, is marked by extensive cloud cover (bottom image). Source: MapBox
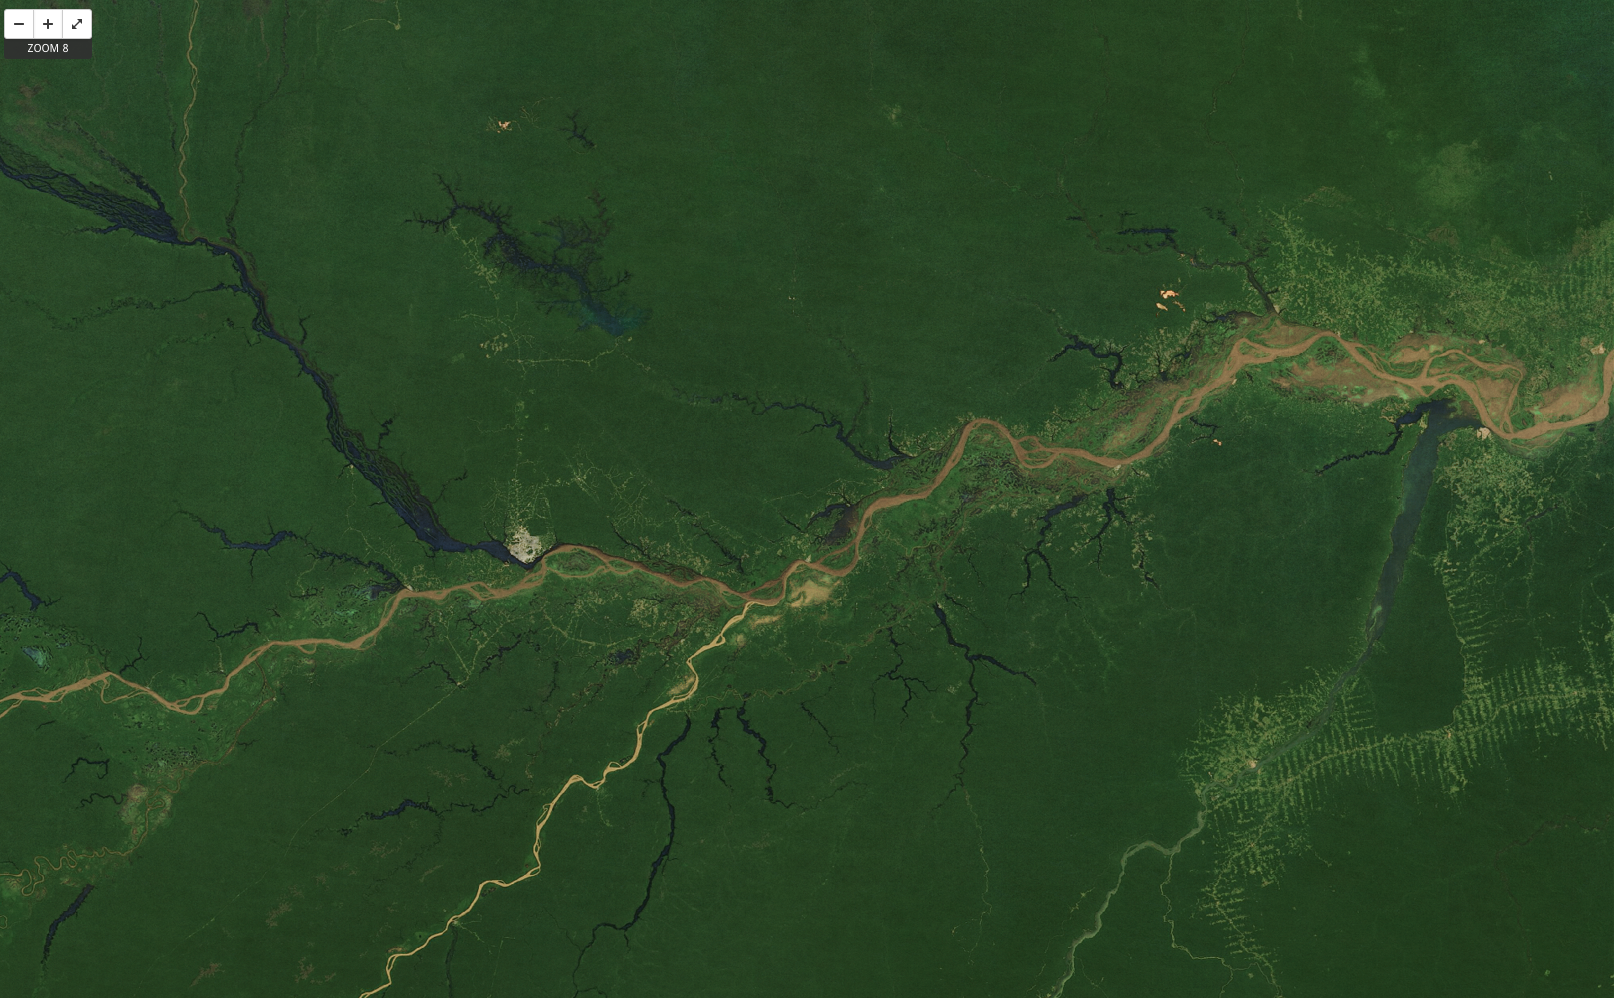
On the centre left is Manaus, Brazil (latitude −3, longitude −60), the economic capital of the central Amazon basin. To its north and east, on the north side of the Amazon, the small orange patches are the exposed soil of bauxite (aluminum) mines. On the south side of the Amazon are networks of logging roads. Source: MapBox
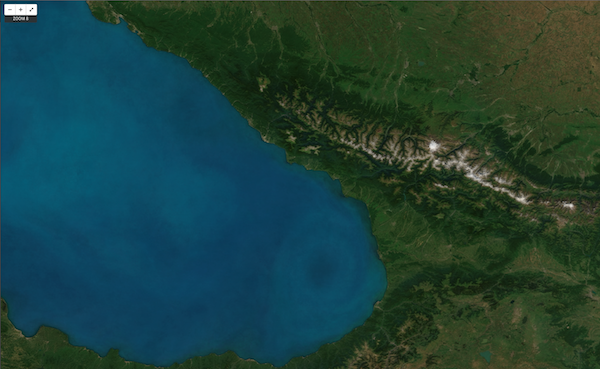
The eastern end of the Black Sea (latitude 42, longitude 40). The southern shore is Turkey; to the east are Armenia and Georgia. To the north, past the Caucasus mountains, is Russia – including the resort town of Sochi, which will host the 2014 Winter Olympics. The ring-like pattern in the sea is the Batumi Eddy, a circulating current rich in phytoplankton. Source: MapBox
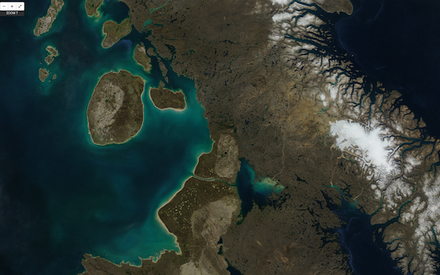
Baffin Island, in the Canadian arctic (latitude 67, longitude −75). The marsh in the central south of this view is Dewey Soper Migratory Bird Sanctuary, the largest goose colony in the world. Source: MapBox
Source: MapBox and Atlantic Cities