
If your company is looking for new talent and you want to share the opportunity with our community, feel free to submit a job using the online form for us to review and include in our list! If you would like to know more about our Geospatial Job Portal, read about it here.
If you are enthusiastic about location data or anything geospatial, then this is the job portal for you!
Looking for more positions in GIS, academia, product, or data science roles? Go directly to our searchable Geospatial Job Portal!
Featured Jobs
 what3words: Senior Partnerships Manager – India
📍 London, UK
This role is highly demanding – long hours and significant international travel opportunities will be the norm. You’ll be expected to meet challenging targets, but you’ll reap the rewards of them too. Your team is a group of talented people from all over the world on an unprecedented journey. Every day brings new challenges and we are always learning. You will be proud to see your individual and team contributions making a real difference. This is your opportunity to help build a global business from the ground up.
 Apple: Mobile Display Cartography Engineer
📍 Santa Clara Valley (Cupertino), CA, US
 Infosys: Geographic Information Systems Consultant
📍 San Francisco, CA, US
 Pivot Bio: Agronomy Drone and Sensors Research Technician
📍 MidWest St. Louis, US
 Lawrence Livermore National Laboratory: GIS Analyst
📍 Livermore, CA, US
 NorthWestern Energy: GIS Technician
📍 Butte, MT, US
Even if these jobs may not be for you, they may help out someone in your network. Please share!
And if there are any specific things you’d like to see in our job portal, feel free to get in touch. Be sure to follow us on LinkedIn as well!

#Featured


Next article
Having spent most of my professional career in newsrooms, I have seen up close how richly-designed maps can help add much-needed context to journalistic narratives. And when you add data to the mix, maps can become a powerful reporting tool for analysis. In fact, correlating hurricane wind speeds and insurance damage reports on a map played an instrumental role in helping the Miami Herald’s Steve Doig and his colleagues win the 1993 Pulitzer Prize.
However, the onus of mapmaking in publication houses has traditionally fallen on a dedicated graphics department, often with a cartographer on staff. I, personally, have never created a map – even though I have been writing about them for over half a decade now. So, when the Netherlands-based Mapcreator introduced their map editor solution to me, insisting “anyone can create maps”, I decided it was time to lose my cartographic virginity.
A brief history of Mapcreator brand
To give you some background on the company, Mapcreator was founded 12 years ago in Eindhoven and quickly made a name for itself in media circles with its mapping tool Maps4News. Today, the geospatial firm – which counts among its clients The Washington Post, CNN, USA Today, South China Morning Post, and many more eminent news organizations – also caters to industries like tourism, broadcasting, government, and real estate. Additionally, it offers a flexible and easy-to-use mapping API to developers.
In 2019-end, the company decided that it was time to consolidate its brands under the single umbrella of ‘Mapcreator’ name because “after all, we create maps”. With the ‘new’ name, came the new mapping tool which was built from the ground up using extensive customer feedback.
“We have taken all the good stuff from the old tool, blitzed it up with some awesome new cutting-edge ingredients in the development team’s creative blender, and produced a new tool that is faster, easier to use, with a bucketload of advanced features,” the team said. “With the new tool, what you see is what you get (WYSIWYG).”
Making static maps with Mapcreator
Coming back to the map editor trial, I figured I couldn’t just go groping in the dark, so I hopped over to their YouTube tutorial (props to Maggie for making the directions crisp and clear).
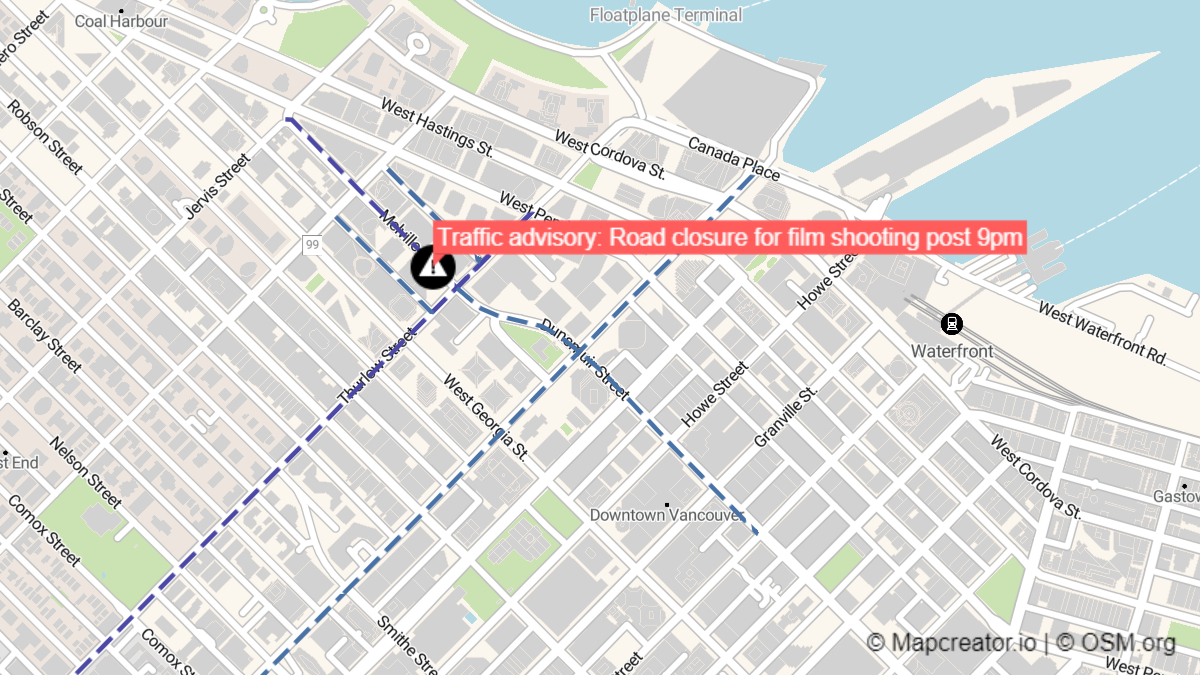
Static road closure map
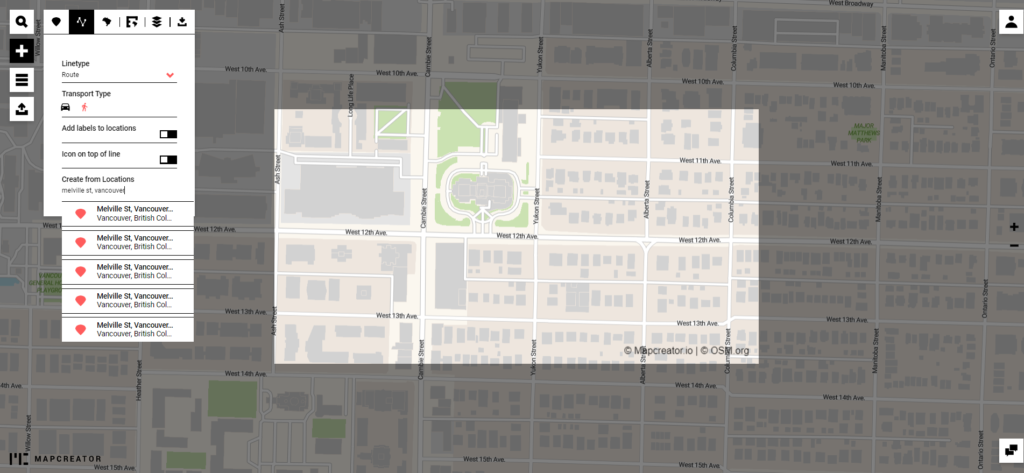
Knowing that Mapcreator gives the option to edit adding icons, annotations, text boxes, lines, etc., on top of the map, I picked up a random story of road closure advisory in Downtown Vancouver, Canada, and started searching for affected streets right inside the map editor.
Mapcreator’s data is powered by OpenStreetMaps and finding the correct locations was a fairly straightforward process.

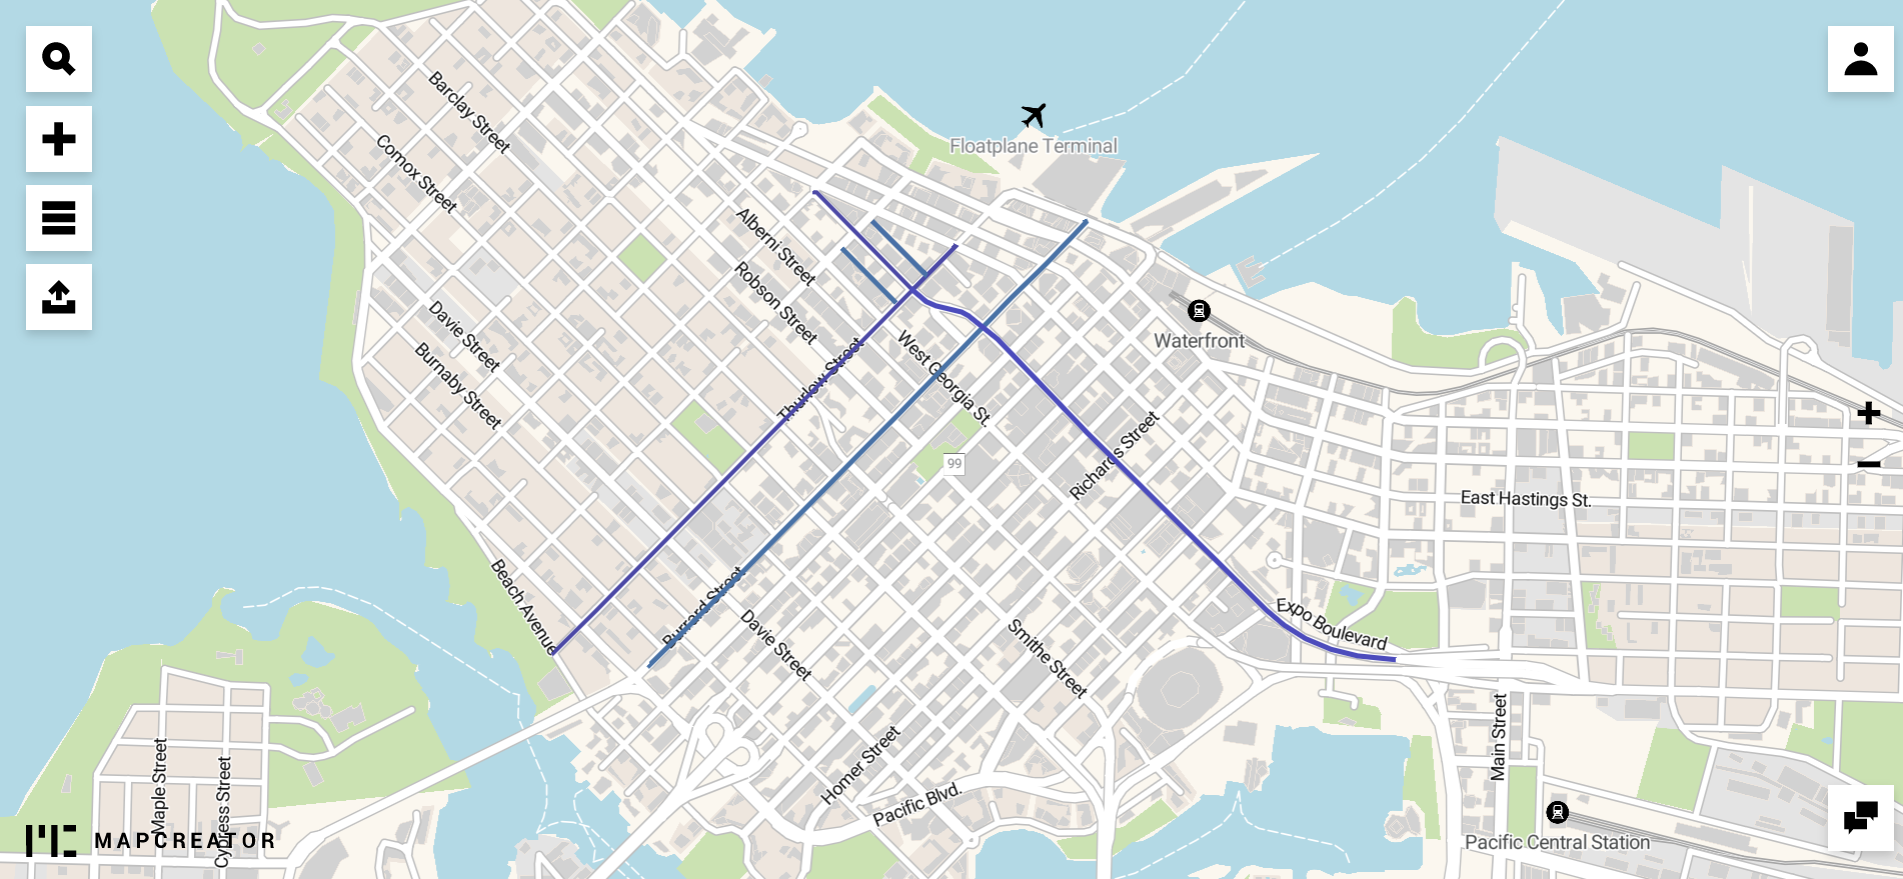
I could pinpoint the route from one place to another or hand-draw the polygons. The lines took the natural curves of the roads, giving me a neat and attractive route selection.
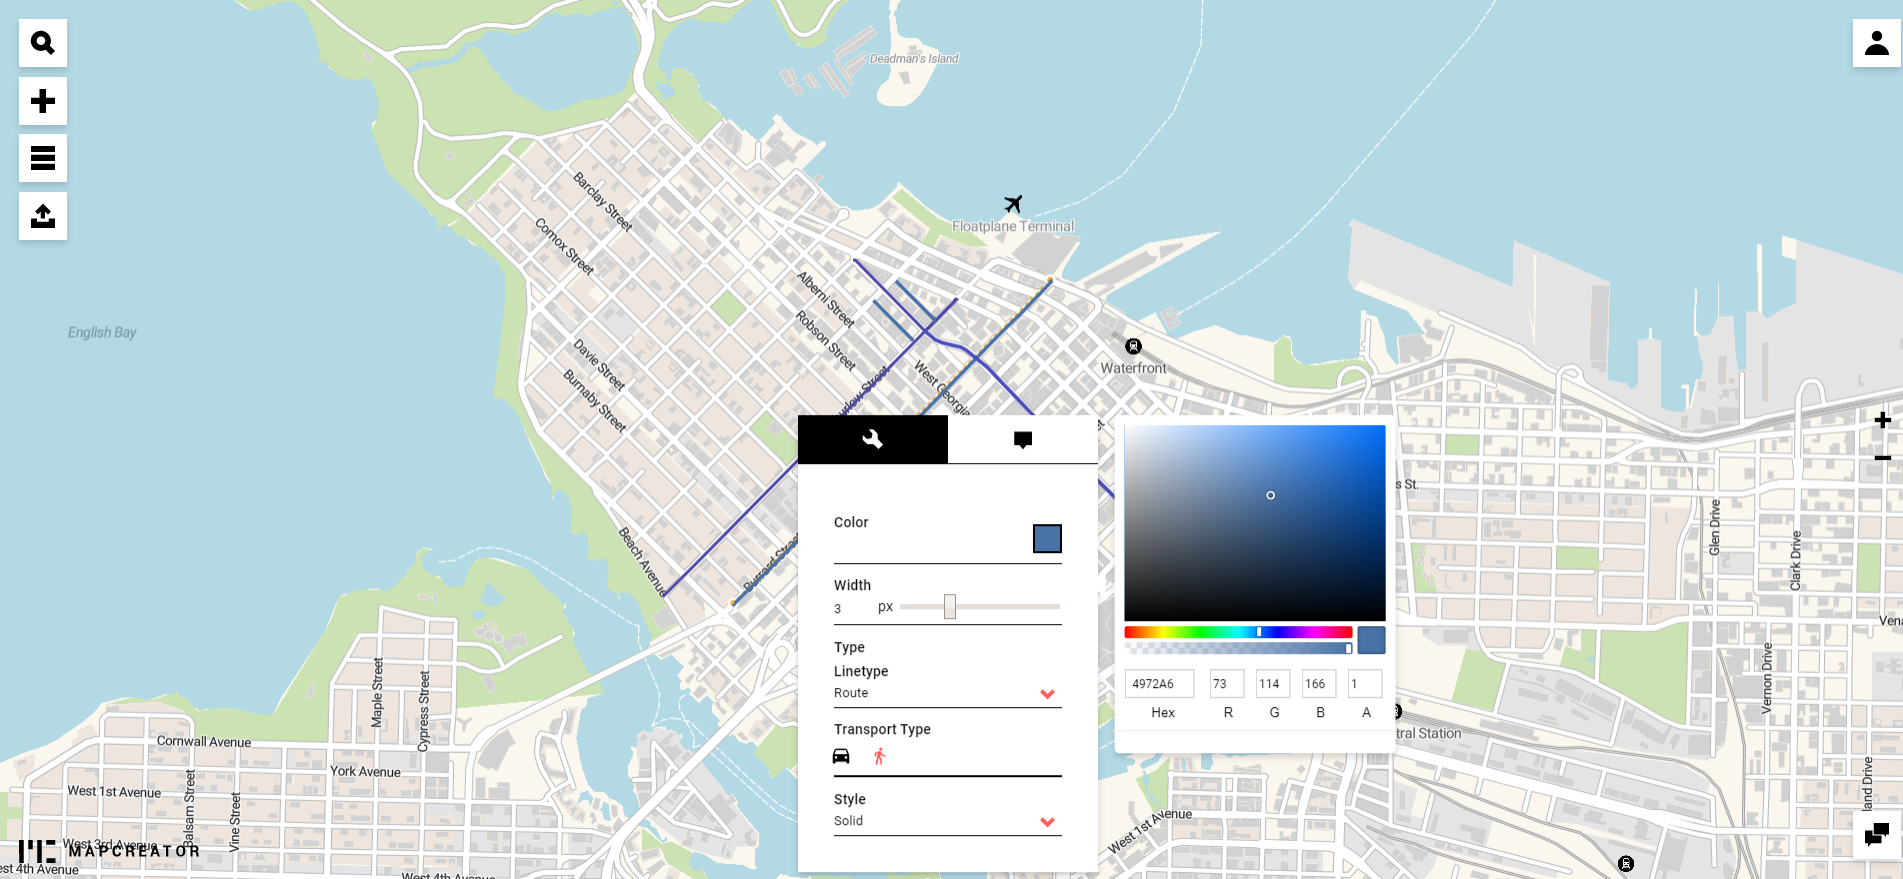
Now it was time to customize the lines for color, width, line style, etc.
I could also add an icon to a geo-referenced location and customize its size and colors to meet any brand guidelines.
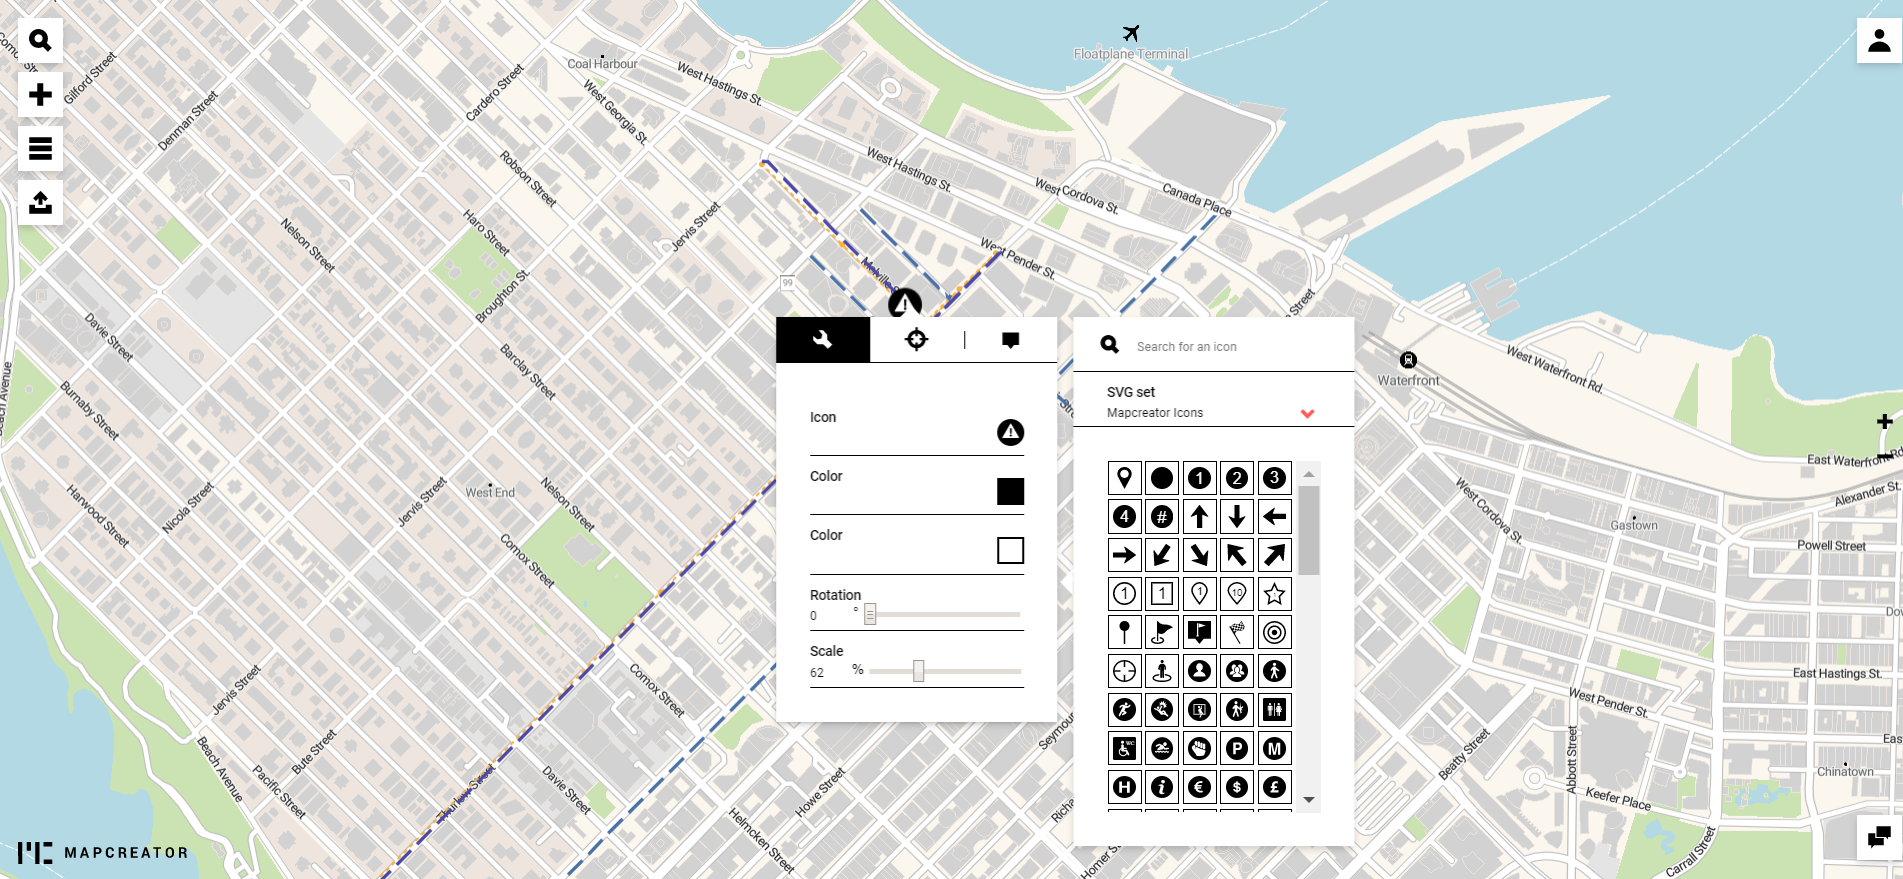
I further attached a text box to the icon to highlight the main news point. Again, every element was customizable.
And voila!
In a nutshell
Pros:
- Allows easy addition of multiple elements on top of a map
- Offers a high degree of customization for each element
- Exhaustive map export options, including filetype and social media presets – very handy!
Cons:
- No provision to undo the last action; deletions are possible only via entire layers (but the good part is that each layer is easily identifiable in the menu)
Making interactive maps with Mapcreator
Moving on…
Who doesn’t love an interactive map?! But can someone who doesn’t have a graphical or cartographical background make dynamic maps? Let’s find out!
Interactive tourist attractions map
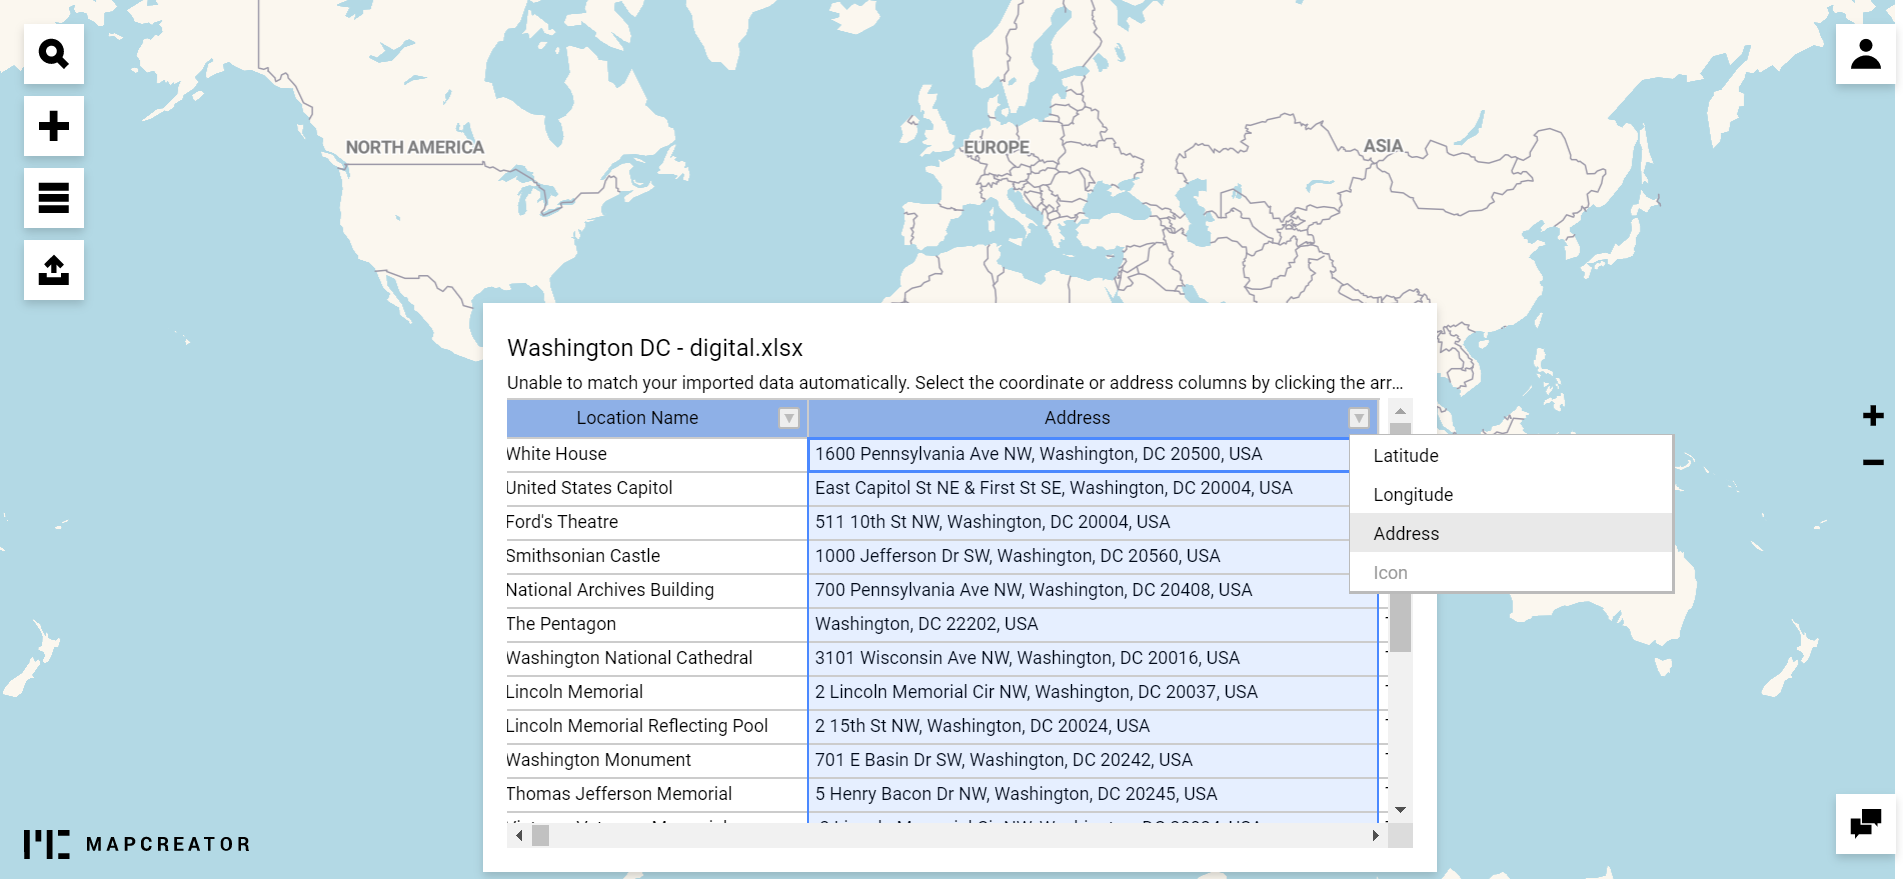
The good part is Mapcreator supports everything from a spreadsheet or KML to GeoJSON and GPX file with a simple drag and drop functionality. I decided to use a location datasheet which gave me the addresses of top tourist attractions in Washington DC. My spreadsheet also contained some descriptive text and images for these points of interest.
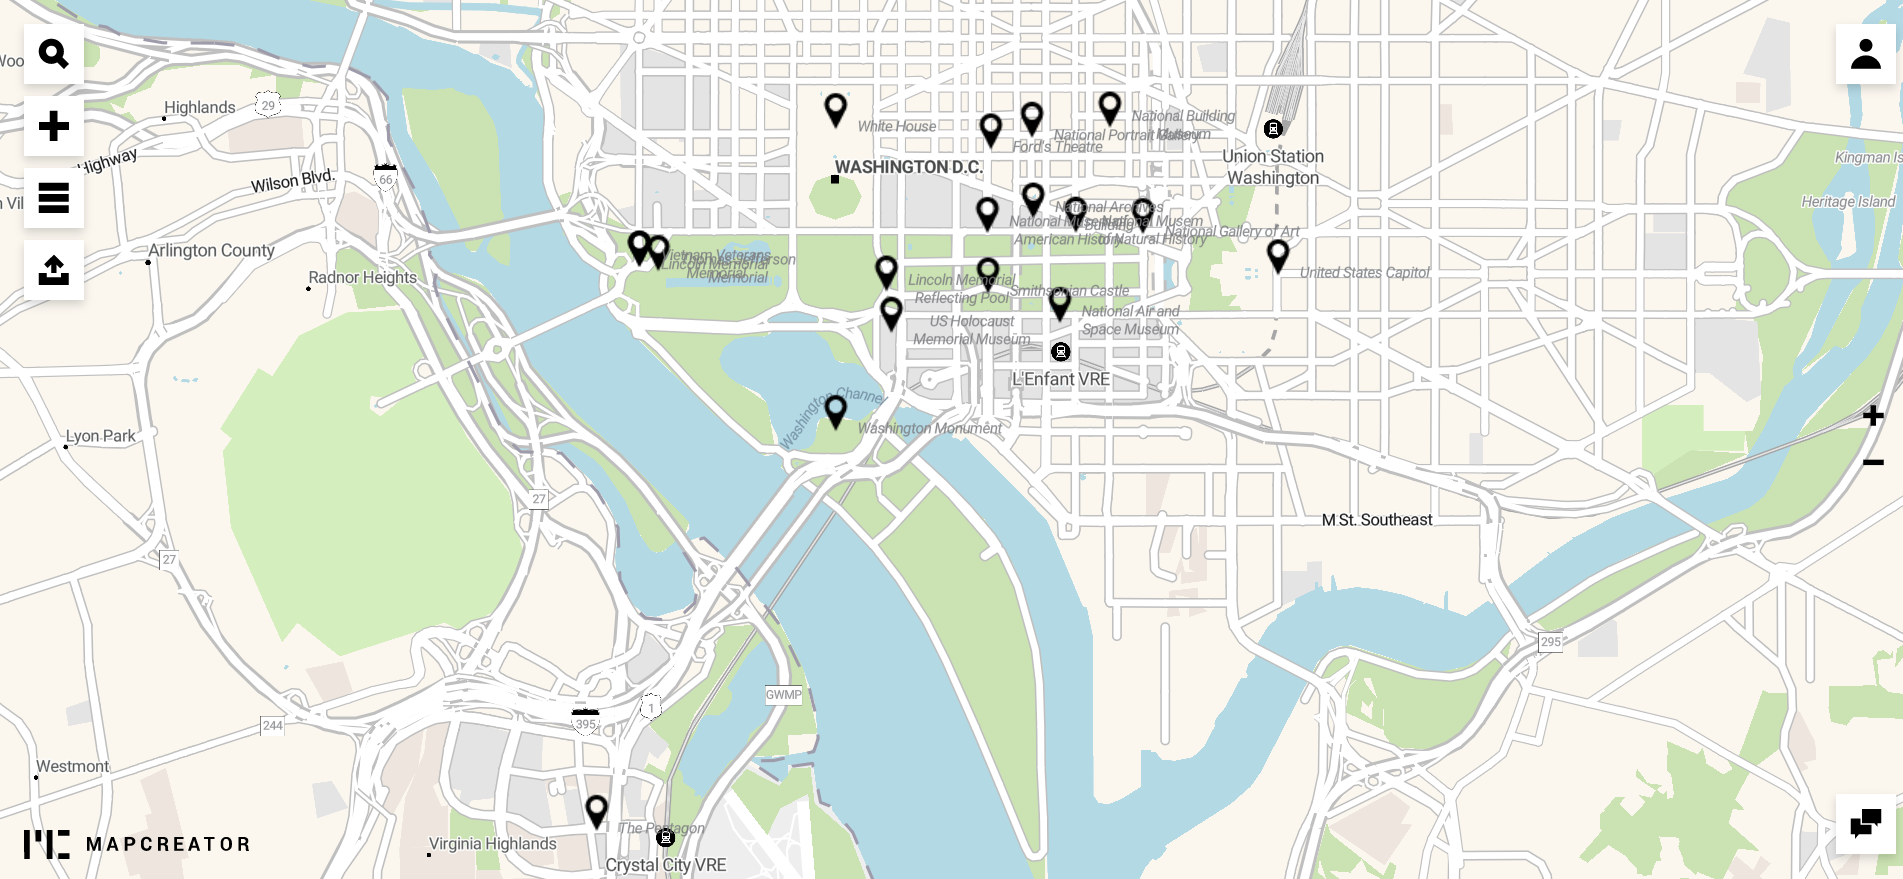
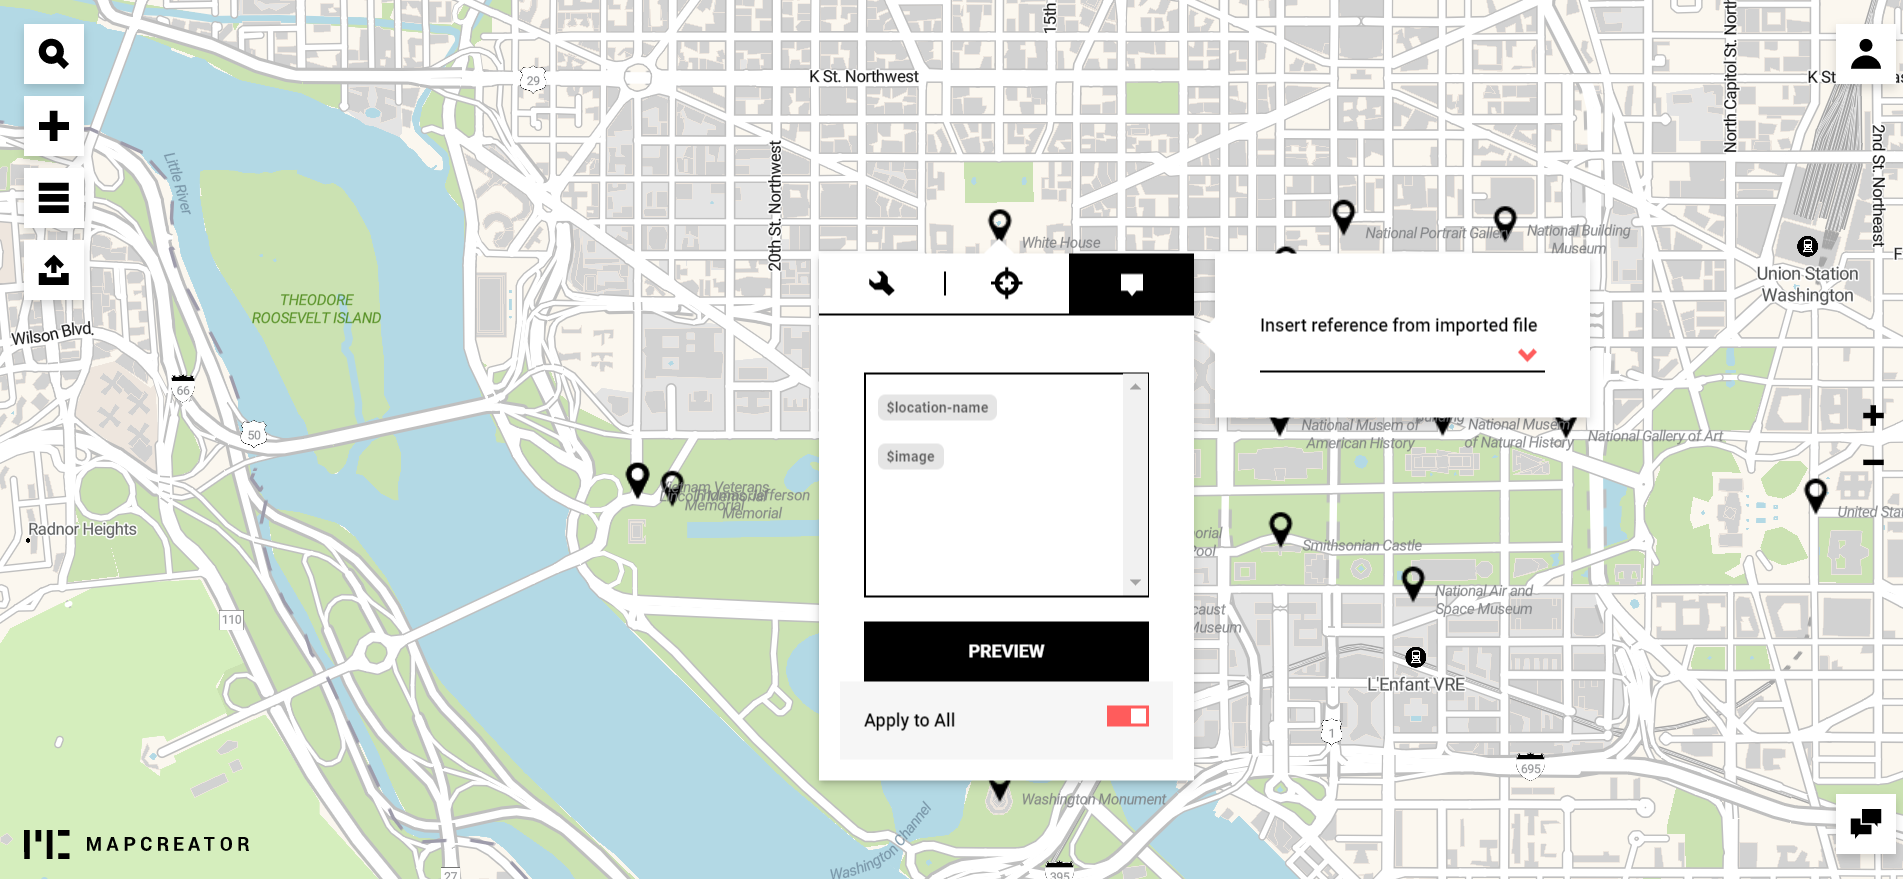
Once the points of interest were ready to be explored on the map, I could freely pan and zoom, and get down to making the map interactive with text, images, weblinks, etc. The default icons can also be changed, by the way – all at once by using the ‘Apply to All’ functionality.
The ‘Apply to All’ functionality sure came in handy when I had to import other data layers, already present in the imported file, onto the map, such as text and images.
To see what the interactive visualization looks like, all I had to do was export the map as a web file. Mapcreator provided me an iframe code and a weblink. You can check out the finished map right here. I have to admit I did not expect this process to be so fast.
In a nutshell
Pros:
- Painless data import and intuitive interface
- Impressive interactive visualizations in a jiffy
- Option to get custom map styles to match brand identity
Cons:
There isn’t much for a novice like me to complain about. So, why don’t you try out Mapcreator for yourself and let me know your feedback in the comments!
To sum up, my takeaway as someone who has never made a map before is that Mapcreator’s mapping tool is quite intuitive and, hence, easy-to-use. Both the static and dynamic maps I created using their map editor solution were completed in no time and looked clean, elegant, and attractive. I’m definitely encouraged to try out making more maps now. What about you?