

After a series of satellite launches related to Earth Observation (EO) in the previous couple of years (Sentinels, IceEye, PAZ, GOES, Landsat, RADARSAT Constellation, CSG-1, etc.) plus the pandemic during last year, the number of EO satellites entering the orbit in 2020 was scarce. This article gives a short update about major planned launch EO spaceflight events related to Earth Observation (EO) satellites in the first half of 2021 and also beyond it. As changes might occur, the article does not state exact dates. The subsequent list does not claim to be complete.
Capella 3 and 4: Two more satellites of the Capella constellation are planned to be launched together with a number of other nano satellites on a Falcon 9 rocket in the first quarter of 2021. Once complete the Capella constellation will consist of 36 X-band radar satellites delivering sub 0.5m imagery at a repeat time of one hour. The originally planned completion of the constellation in 2021 will probably be shifted backwards. The owner of the satellites is Capella Space.
Pléiades Neo: The planned launch of Pléiades Neo 1 in the second half of 2020 was postponed to this year. In early 2021 the first 2 satellites of the Pléiades Neo constellation consisting of four identical satellites will be launched by a Vega rocket departing in Guyana Space Center. A second batch will follow in the second quarter of 2022. The constellation owed by Airbus will deliver optical satellite imagery at an unprecedented resolution of 30cm. The acquired 2 million km² per day will be fully dedicated to the commercial market.
LARES 2: The Laser Relativity Satellite 2 is a passive satellite of the Italian Space Agency (Agenzia Spaziale Italiana – ASI). It is equipped with laser mirrors for the study of the Earth’s gravitational field, general relativity measurements and the measurement of the Lense-Thirring effect. It is due to launch on a Vega rocket around mid 2021.
COSMO-SkyMed 2nd generation (CSG): The second satellite of the CSG mission (CSG-2) will be launched in the second half of 2021. The second generation of COSMO-SkyMed satellites is the first synthetic aperture radar (SAR) satellite system in the world able to acquire two images simultaneously. It will ensure continuity of the X-band radar data archive with improved functionalities of the new satellites. COSMO-SkyMed is an Earth observation program of the Italian Space Agency. The contractor for the satellites is Thales Alenia Space.
SARah: SARah is the planned follow-on system for the SAR-Lupe radar satellite constellation operated by the German armed forces (Bundeswehr). SARah consists of one active phased array-antenna satellite built by Airbus Defence and Space and two passive reflector antenna satellites provided by OHB-System. The satellite will be launched with a co-passenger on a Falcon-9 rocket until September 2021.
Landsat: After the launch of Landsat-8 in 2013, a new satellite of the series, Landsat-9, is waiting to be launched in September 2021. It will continue Landsat’s irreplaceable 44-year data record of the Earth’s land surface providing users worldwide with high-quality, global, land-imaging measurements.
On its website ESA announces the next Galileo launch in the third quarter of 2021. The exact date still is under discussion.
Apart from these major launches, numerous nano satellites developed for research purposes by Universities or research institutions/companies will be launched in the 1st half of 2021.
A couple of launches will be (in)directly dedicated to human space flight:
- The Northrop Grumman’s 15th contracted resupply services mission will deliver tons of cargoes and supplies to the International Space Station (ISS) onboard an uncrewed Cyngnus spacecraft. Supported by NASA, the resupply mission is planned to be launched on 20th February 2021. See NASA launch schedule 2021.
- On March 29 2021 Boeing will perform its second unscrewed flight test of the Boeing’s CST-100 Starliner. The Starliner is a next-generation space capsule that will take people to and from low-Earth orbit. Crewed flight tests with NASA astronauts Mike Fincke, Nicole Mann, and Barry “Butch” Wilmore will follow no earlier than June 2021.
- A United Launch Alliance Atlas V rocketwill launch the USSF-8mission for the Space Force’s Geosynchronous Space Situational Awareness Program (GSSAP). It will lift off from Space Launch Complex 41 at Cape Canaveral Space Force Station in Florida.
- NASA astronauts Shane Kimbrough and Megan McArthur, JAXA astronaut Akihiko Hoshide and French ESA astronaut Thomas Pesquet will fly to the ISS on board of a Dragon spacecraft in the second quarter of 2021. The Dragon spacecraft of SpaceX is capable of carrying up to 7 people to and from Earth orbit. It is currently the only spacecraft capable of returning significant amount of cargo to Earth.
Following websites list launches of any kind of satellites or vehicles:
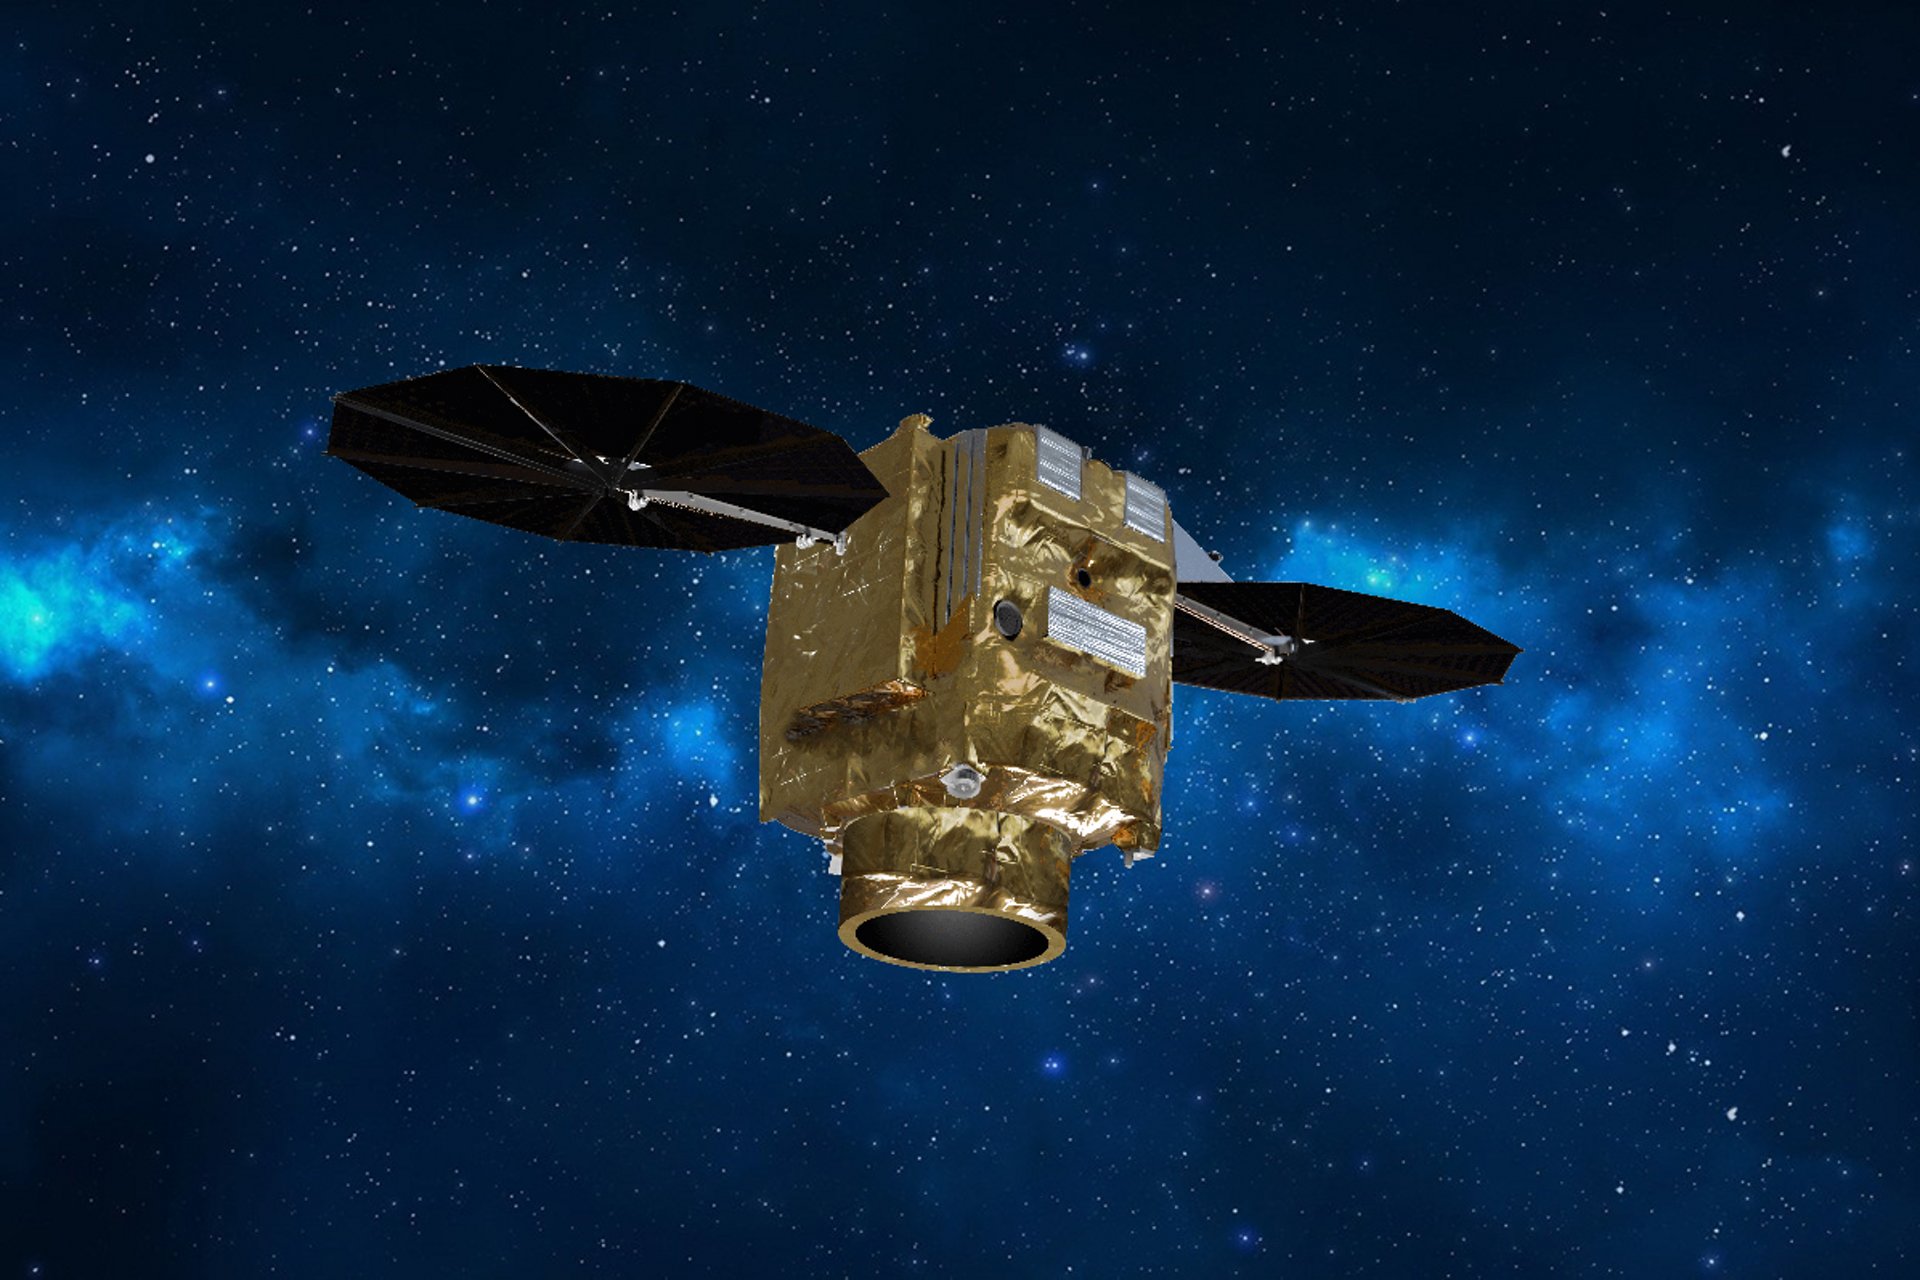
Pléiades Neo satellite. Source: Airbus

#


Next article
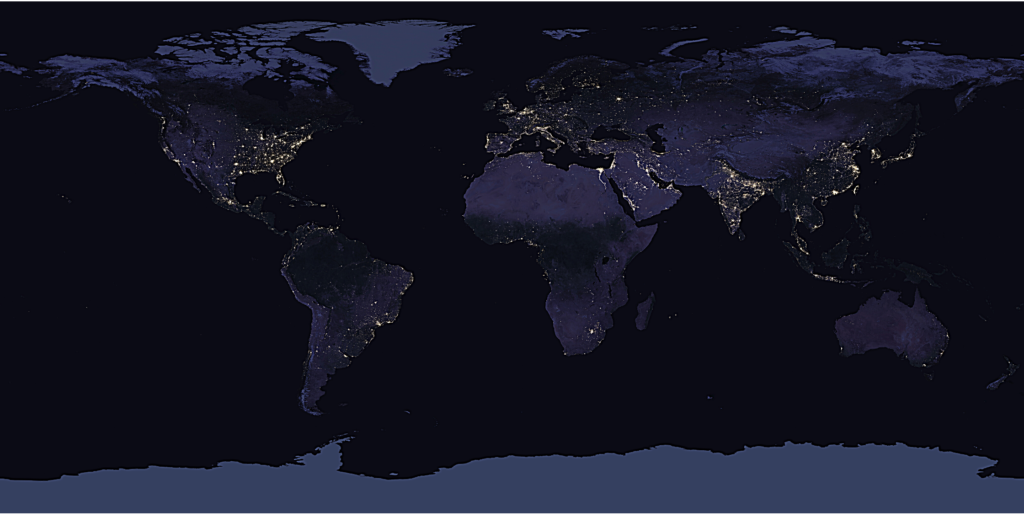

Among all human inequalities, unequal energy consumption is unique in being easily visible from space. Satellite images captured at night are proving to be a promising source of data for measuring access to electricity. Access to electricity is not the only thing that can we can measure from above. A Canadian based company called clearGRID focuses on aerial collection and analysis of radiofrequency (RF) data mainly for the utility and energy industries. They use an aeroplane to collect meter readings for utilities billing systems, such as gas, water and electricity. Ellen Christopherson, the CEO and founder of clearGRID, joined Daniel ODonohue in Episode 63 of the Mapscaping podcast, to talk about this and so much more. Collection of meter data from the sky is a unique method for utility and energy companies to get their readings for billing. How did we get here?
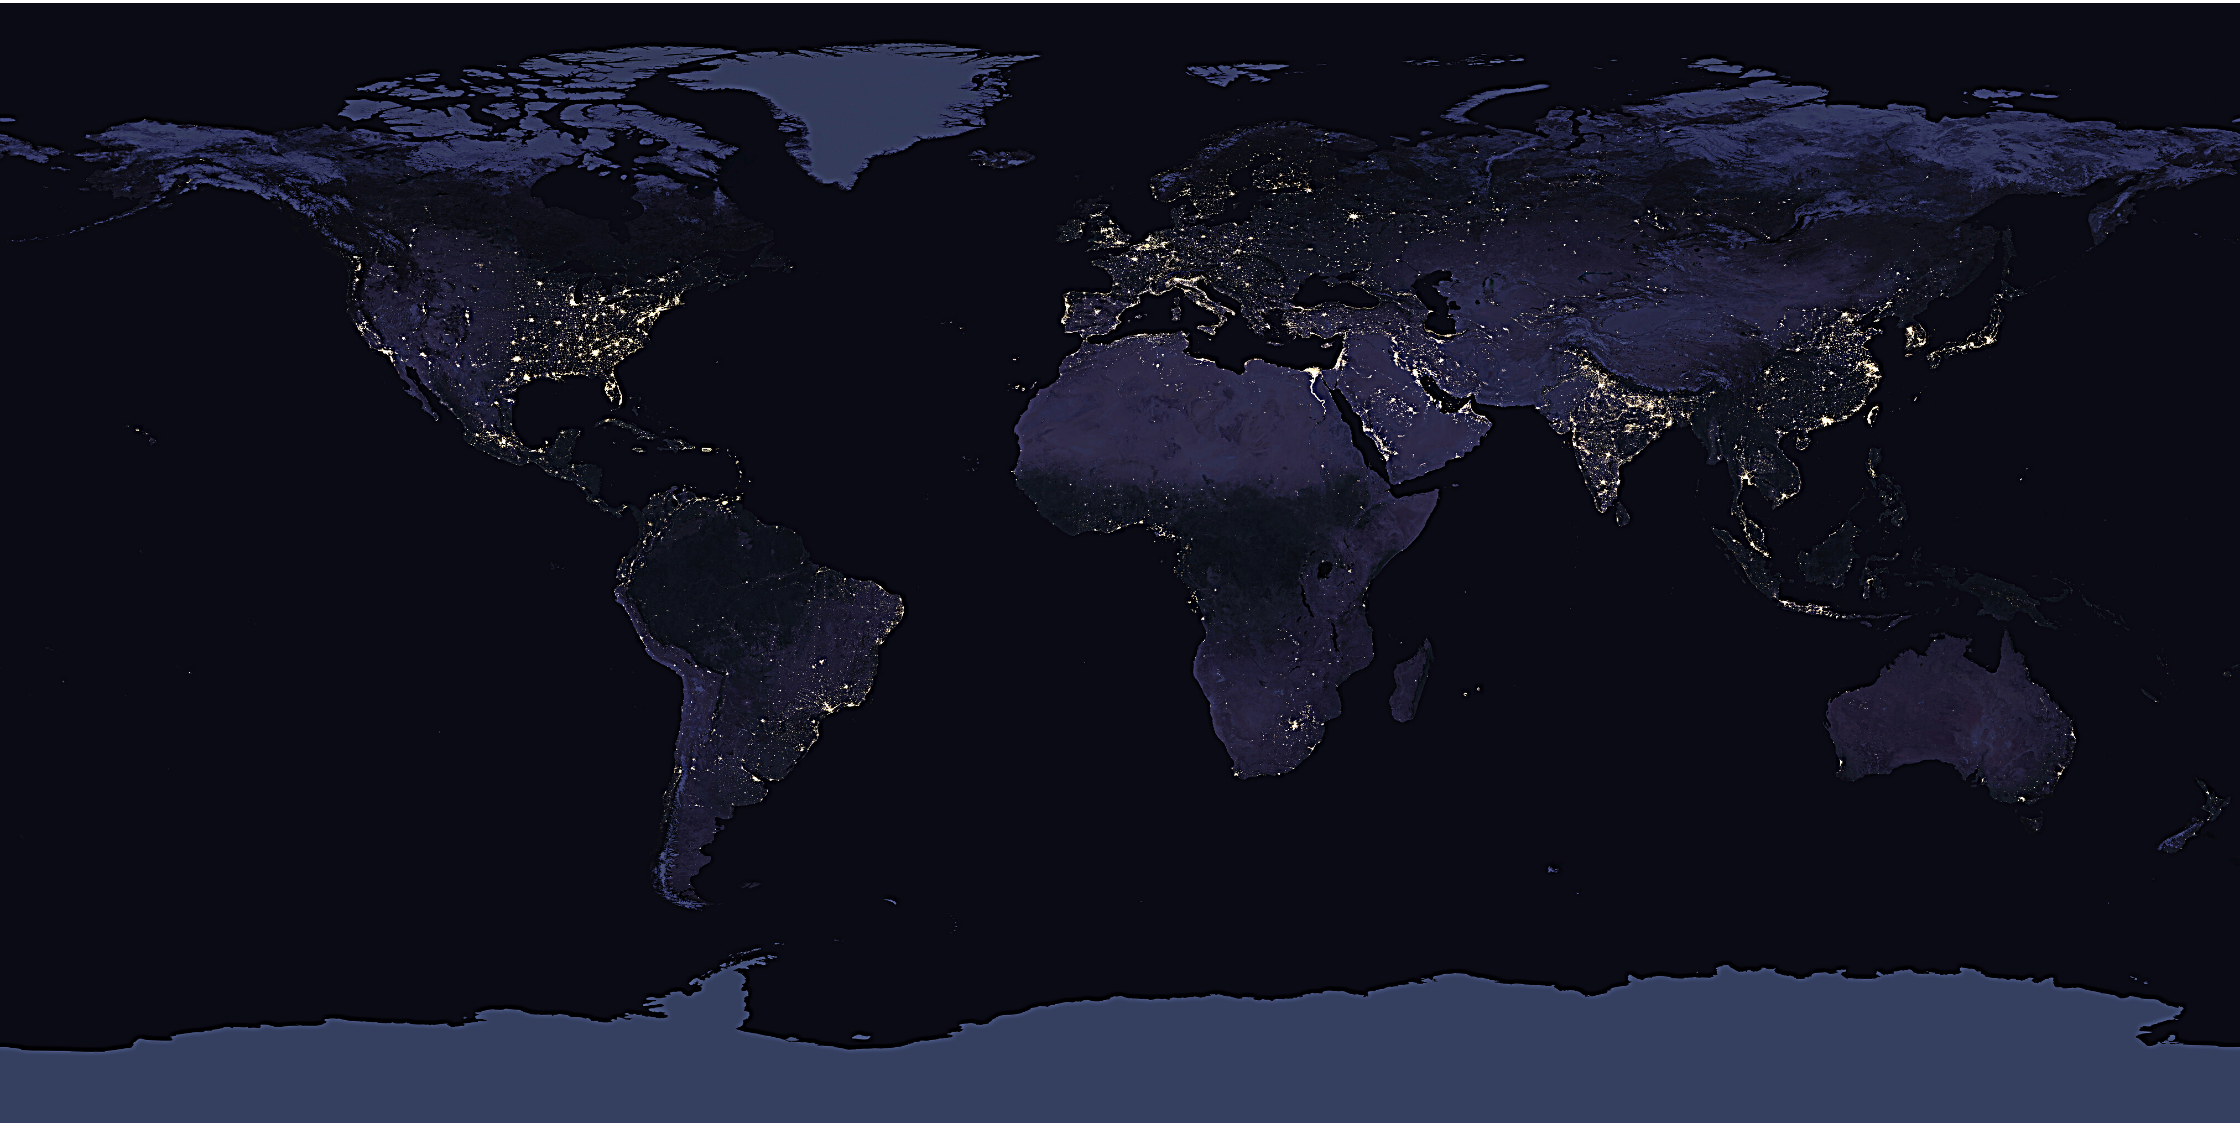
A view of the earth at night showing artificial sources of light constructed from a series of satellite images taken by the U.S. National Aeronautics and Space Administration and the U.S. National Oceanic and Atmospheric Administration over the course of 2016.
Credit: NASA Earth Observatory images by Joshua Stevens, using Suomi NPP VIIRS data from Miguel Román, NASA’s Goddard Space Flight Center.
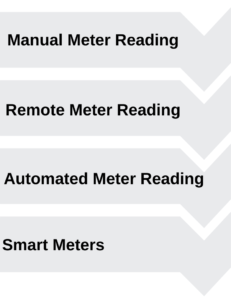
The Evolution of Meter Readings Technologies
Still valid today is the lesson from the first industrial revolution–that the extent to which society embraces technological innovation is a major determinant of progress. (Schwab, 2016)
The advancement of meter reading technologies is being driven by the need for accessibility, safety, accuracy, timeliness, privacy, efficiency, cost reduction and conservation.
Note that the adoption of these technologies varies from one region to another.
While some countries and regions are ahead in the adoption of the technologies discussed below, others lag far behind, some even lacking access to basic utilities.
According to the World Bank SDG Atlas 2020, robust population growth in parts of the world underserved by energy infrastructure left nearly 789 million people without access to electricity in 2018. Even more—2.8 billion—lack access to clean cooking fuels and technologies.
Manual Meter Readings
This is where the meter reader reads the register dials and records the reading in a ledger book. A billing clerk then uses the ledger book to compute usage from previous readings and calculates and issues the bill.

Source: Clipart Library
This method has several drawbacks. First, it is time-consuming and labour intensive, especially if there are multiple meters or the area of coverage is large. Second, the meter may be in a place that is difficult to access and read, such as a basement, or underground meter pit. Third, the meter reader may not be safe, e.g., if there is a dog in the compound. Fourth, the meter reading may be inaccurate because of human error. These drawbacks led to the development of Remote Meter Reading technologies.
Remote Meter Readings
remote adjective,
re·mote | \ ri-ˈmōt \
being, relating to, or involving a means of doing or using something indirectly or from a distance: such as collecting data about something (such as an object or an area) from a distance (as by using radar or photography)
The key driver for remote meter readings was accessibility to meters in inaccessible areas such as basements and meter pits. It still requires physical access to the building. Types of remote meter versions for water utilities are:
- Visual Read Remote Meters-A wire connects the meter (which may be in an inaccessible location such as a basement) to an outside register. The meter reader reads and records readings in a ledger without entering the building. These readings are still prone to human errors and other accessibility issues, such as a hostile homeowner.
- Scan Read Remote Meters-A wire connects the meter register (in an inaccessible location) to an outside coupler. The meter reader attaches a battery-operated handheld reader to the coupler to get a visual reading of register dial. The reading is then recorded in a ledger. Later improvements allowed the collection and processing of readings electronically.
Automated Meter Readings
automate verb
/ˈɔːtəmeɪt/
to change a factory, office, or process so that machines do the work instead of people
Automated meter reading methods are remote, with the major difference being that they do not require physical access. Automated meter reading helps to eliminate misreading errors, estimated calculations and time spent doing follow-ups. It enables easy access to meter data without having to disturb the end-users and computation of accurate bills based on the actual usage.
In the mid-1980s to early 2000s, the adoption of technologies such as power line transmission, radio frequencies, telephones and satellites to transmit data from the meter to the utility companies led to the development of Automated Meter Reading Technology (AMR). This was an advancement whose key driver was to enable the utility providers to get meter readings more accurately without physically accessing a building. Meters using this technology can only support one-way communication, i.e., transfer meter readings from the electric meter in the home to the utility provider. Most AMR meters usually communicate through radio frequency signals.
Smart Meters
Advanced Metering Infrastructure (AMI) began emerging around 2005. We know meters using AMI technology as smart meters. All AMI systems contain AMR functionality, but all AMR systems are not AMI systems. Smart meters can directly send usage data back to the utility provider and in turn, receive data from the provider. They allow two-way communication between the meter and the supplier. They collect more data than AMR meters, such as possible leaks and peak hours of usage. Utility providers can collect the consumption of a utility in real-time with more accuracy. Smart meters can send data through wireless technology such as Radio Frequencies and Wi-Fi networks or wired connections such as power lines.
The key drivers of a smart meter are to monitor energy consumption and improve energy efficiency. Countries are working towards reducing their carbon emissions to mitigate the effects of climate change. Smart meters contribute towards this by reducing wastage and encouraging consumers to change their behaviour. By providing them with their consumption patterns, consumers can regulate their power consumption based on their needs. Financial incentives from the savings gained can also encourage consumers to change their behaviour.
Meter Readings Using Radio Frequencies
Radiofrequency is the most common means of communication between a remote device and a data collection system. Meters using AMR or AMI technologies can communicate via radiofrequency. To conserve battery life, some meters have to be activated by a ‘wake up’ signal from the data collection system to send the meter read and other information like tamper attempts, battery status, leaks, etc. Others are regularly transmitting readings and other data and therefore do not need a ‘wake-up’ call.
Factors Affecting the Propagation of Radio Frequencies
“But what we have found when we’ve been driving around trying to collect data is that signal is obstructed from all kinds of different objects.” (ODonohue, 2020, 4:12)
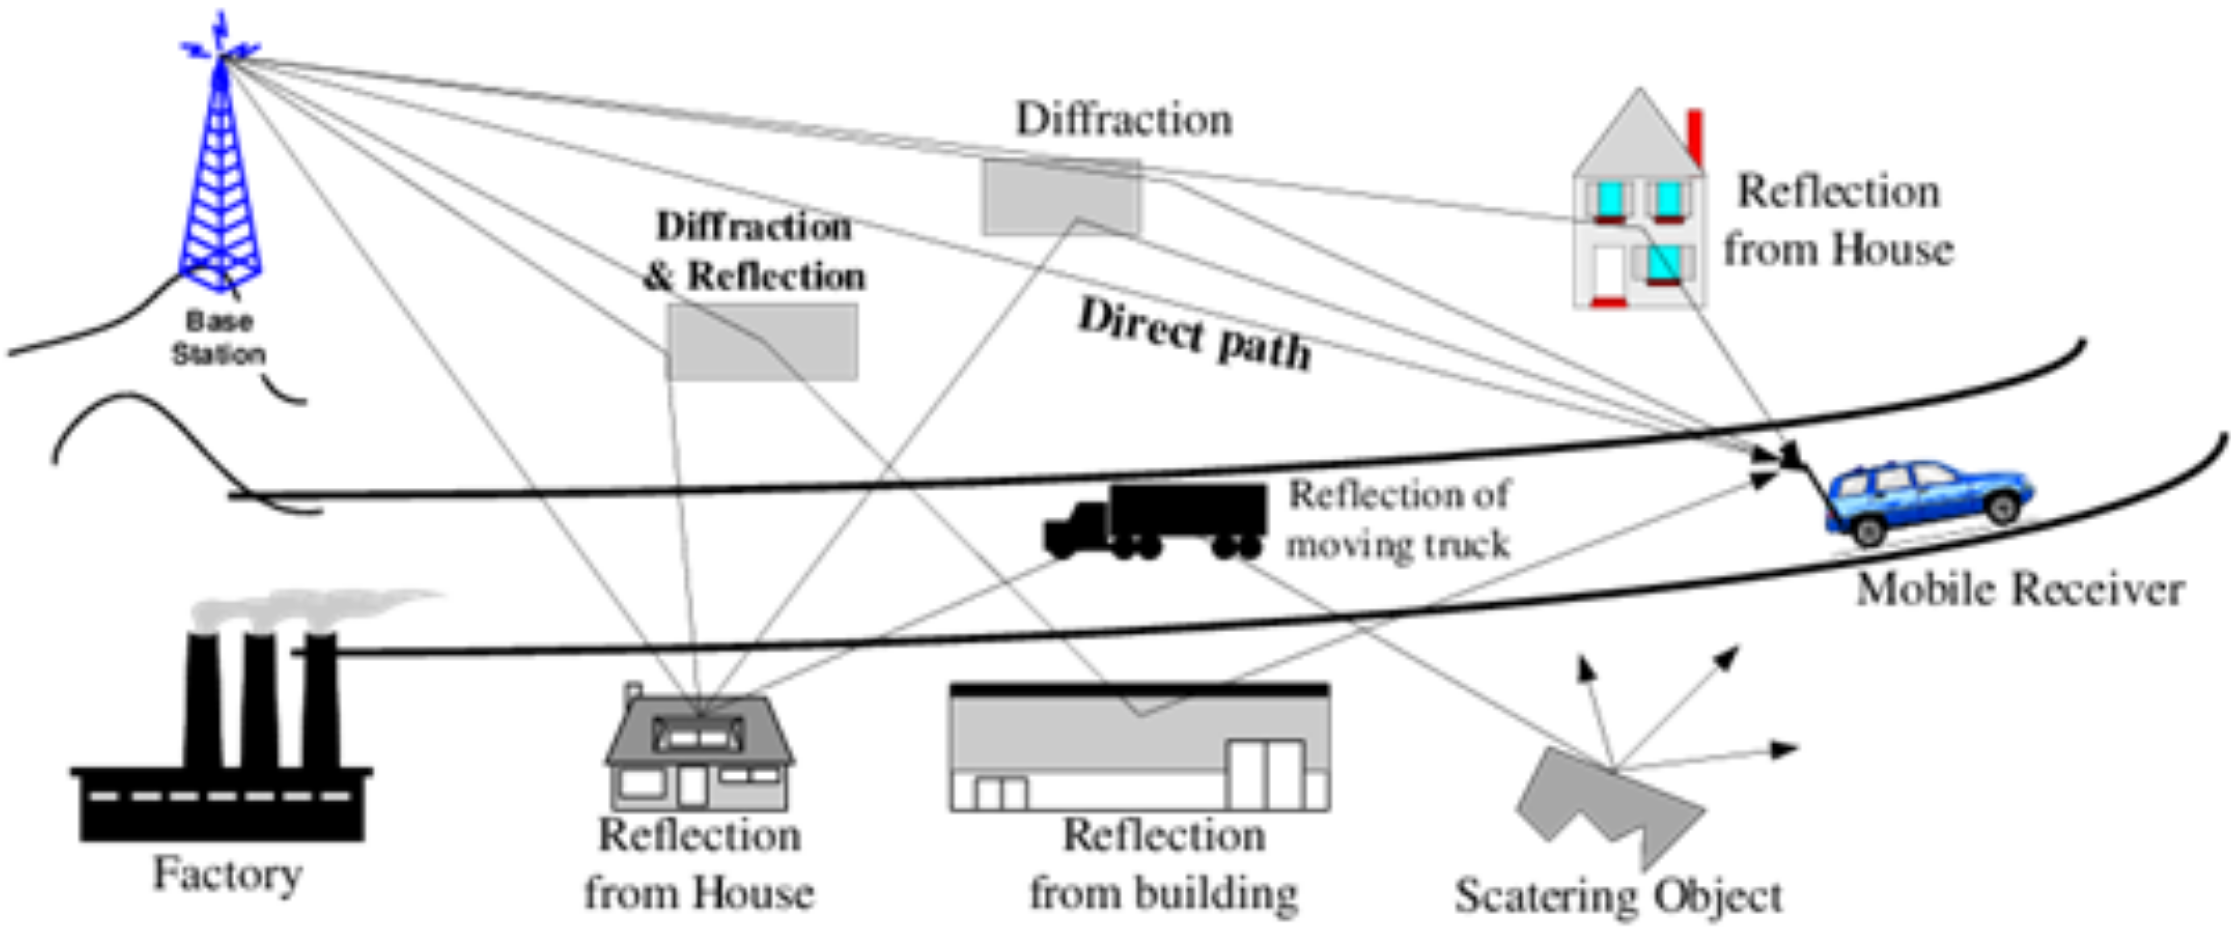
Illustration of radio wave interference. Source: https://www.researchgate.net/figure/Illustration-of-reflection-diffraction-scattering-and-absorption_fig2_228041875
Because radio waves travel through the atmosphere, like light waves, they can be reflected, absorbed, scattered, refracted etc. Physical objects such as trees, buildings and vehicles in the path between the utility meter and the data collection system are some of the most common sources of interference. These weaken or sometimes completely prevent the radio frequency signals from passing through.
Methods of Collecting Data Using Radio Frequencies
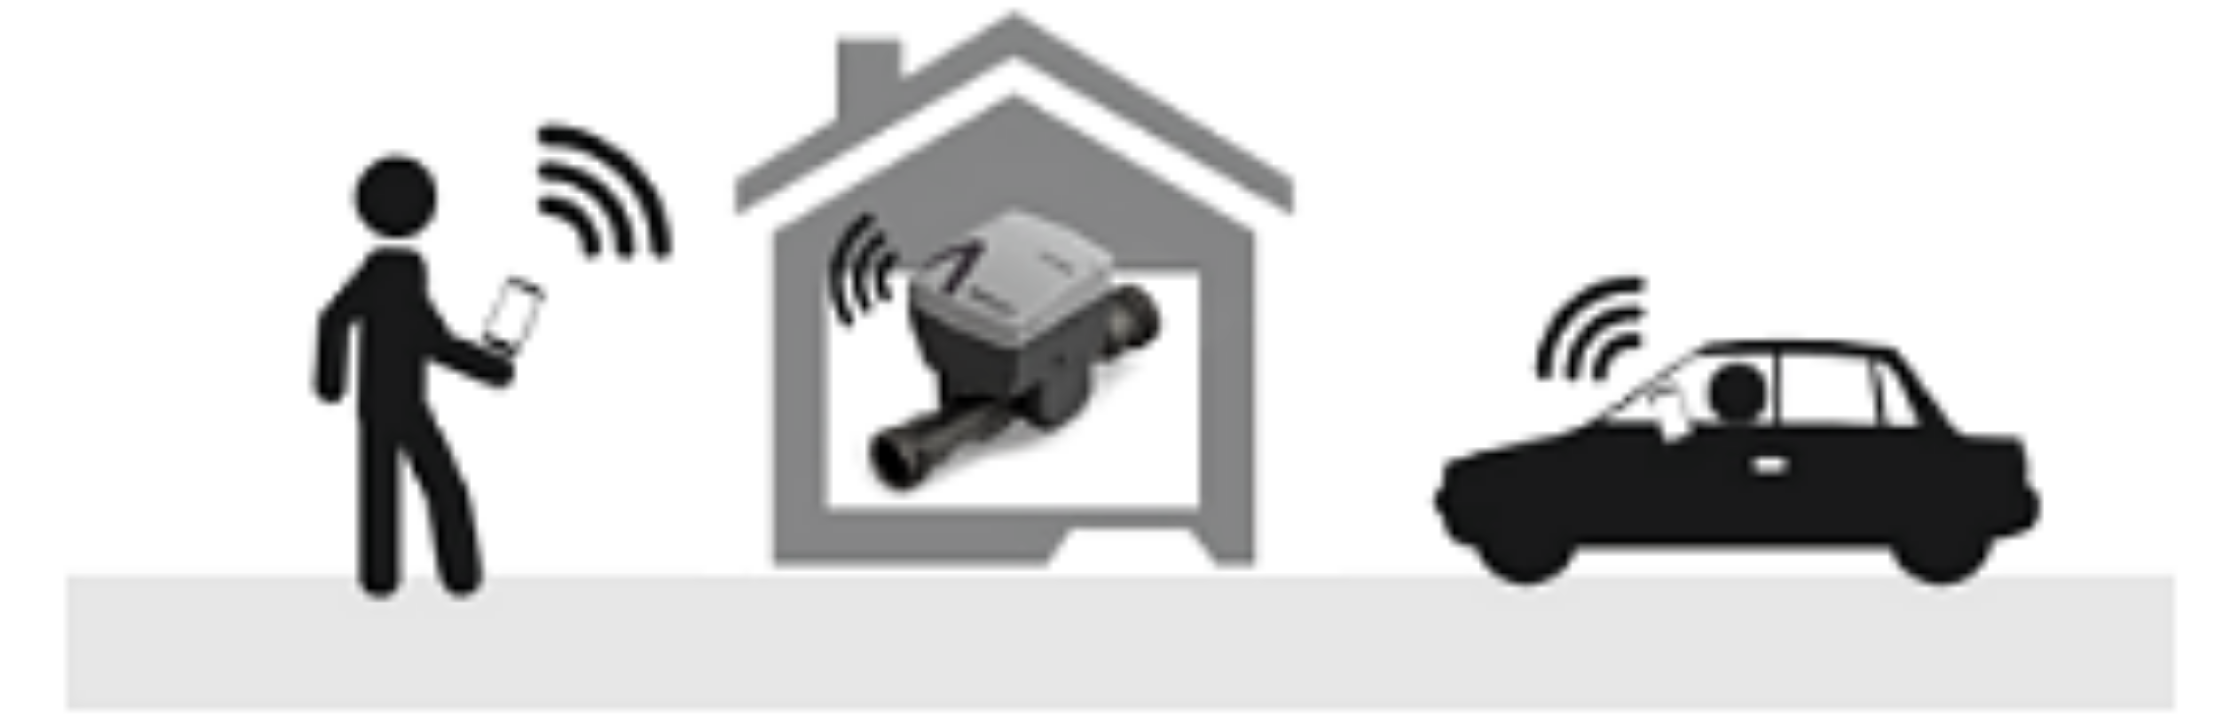
Illustration of ‘Walk-by’ & ‘Drive-by’ data collection methods. Source: https://integra-metering.com/solution/systems-software/
- ‘Walk-by’ Handheld Data Collection Method
This is where a meter reader carries a handheld computer fitted with a radio receiver/transmitter and walks by buildings, without entering them, within the service area. The meter devices send their reads to the handheld computer. The meter reader accepts the read and keeps walking along the route. This method is useful in areas that are inaccessible to vehicles.
- ‘Drive-by’ or Mobile Data Collection Method
This method uses vehicles fitted with a reading device that has radio receivers and transmitters. The utility provider also loads the route information on the reading device. Because some meters are not regularly transmitting, the reading device transmits a ‘wake-up’ radio signal to the RF meters within range and receives the readings they send. This data is then uploaded to the billing system. ‘Drive-by’ method is more efficient than the ‘walk-by’ method since it is faster, thus one can cover a larger area. It is suitable for areas with dense populations.
- Aerial Data Collection Method
“So, your solution is to fly around on a plane and collect this kind of data. Can you tell me what that looks like? in practice?” (ODonohue, 2020, 4:12)

Diamond Aircraft DA42-VI. Source: https://www.diamondaircraft.com/en/about-diamond/newsroom/news/article/new-diamond-aircraft-with-jeppesen-pre-loaded-digital-data/#gallery_-2
This is whereby an aeroplane flying at roughly 4,500 feet above the ground takes meter readings from the sky. The plane flies over buildings recording RF signals being transmitted by utility meters. For meters that are not regularly transmitting, the reading device transmits a ‘wake-up’ radio signal to the RF meters within range and receives the readings they send.
Before the flight, clearGRID gets GPS coordinates of all the meters in the utility company’s service area. These are used to plan the flight path, which is loaded to the aircraft.
How Radio Frequency Data Collection Systems Determine Meter Location
“The other thing is that often times, we’re not really sure where that meter is actually located.” (ODonohue, 2020, 4:12)
Meters do not send location data to data collection systems. Service providers assign each meter a unique number for each address. The meter transmits the unique number together with the meter reading. It does not transmit any personal information. Utility service providers, therefore, determine a customer bill by matching the customer’s address to the meter number assigned for that location.
“… the addresses become less of a problem that way, because we create our own coordinates that we need to hear the signal at.” (ODonohue, 2020, 5:45)
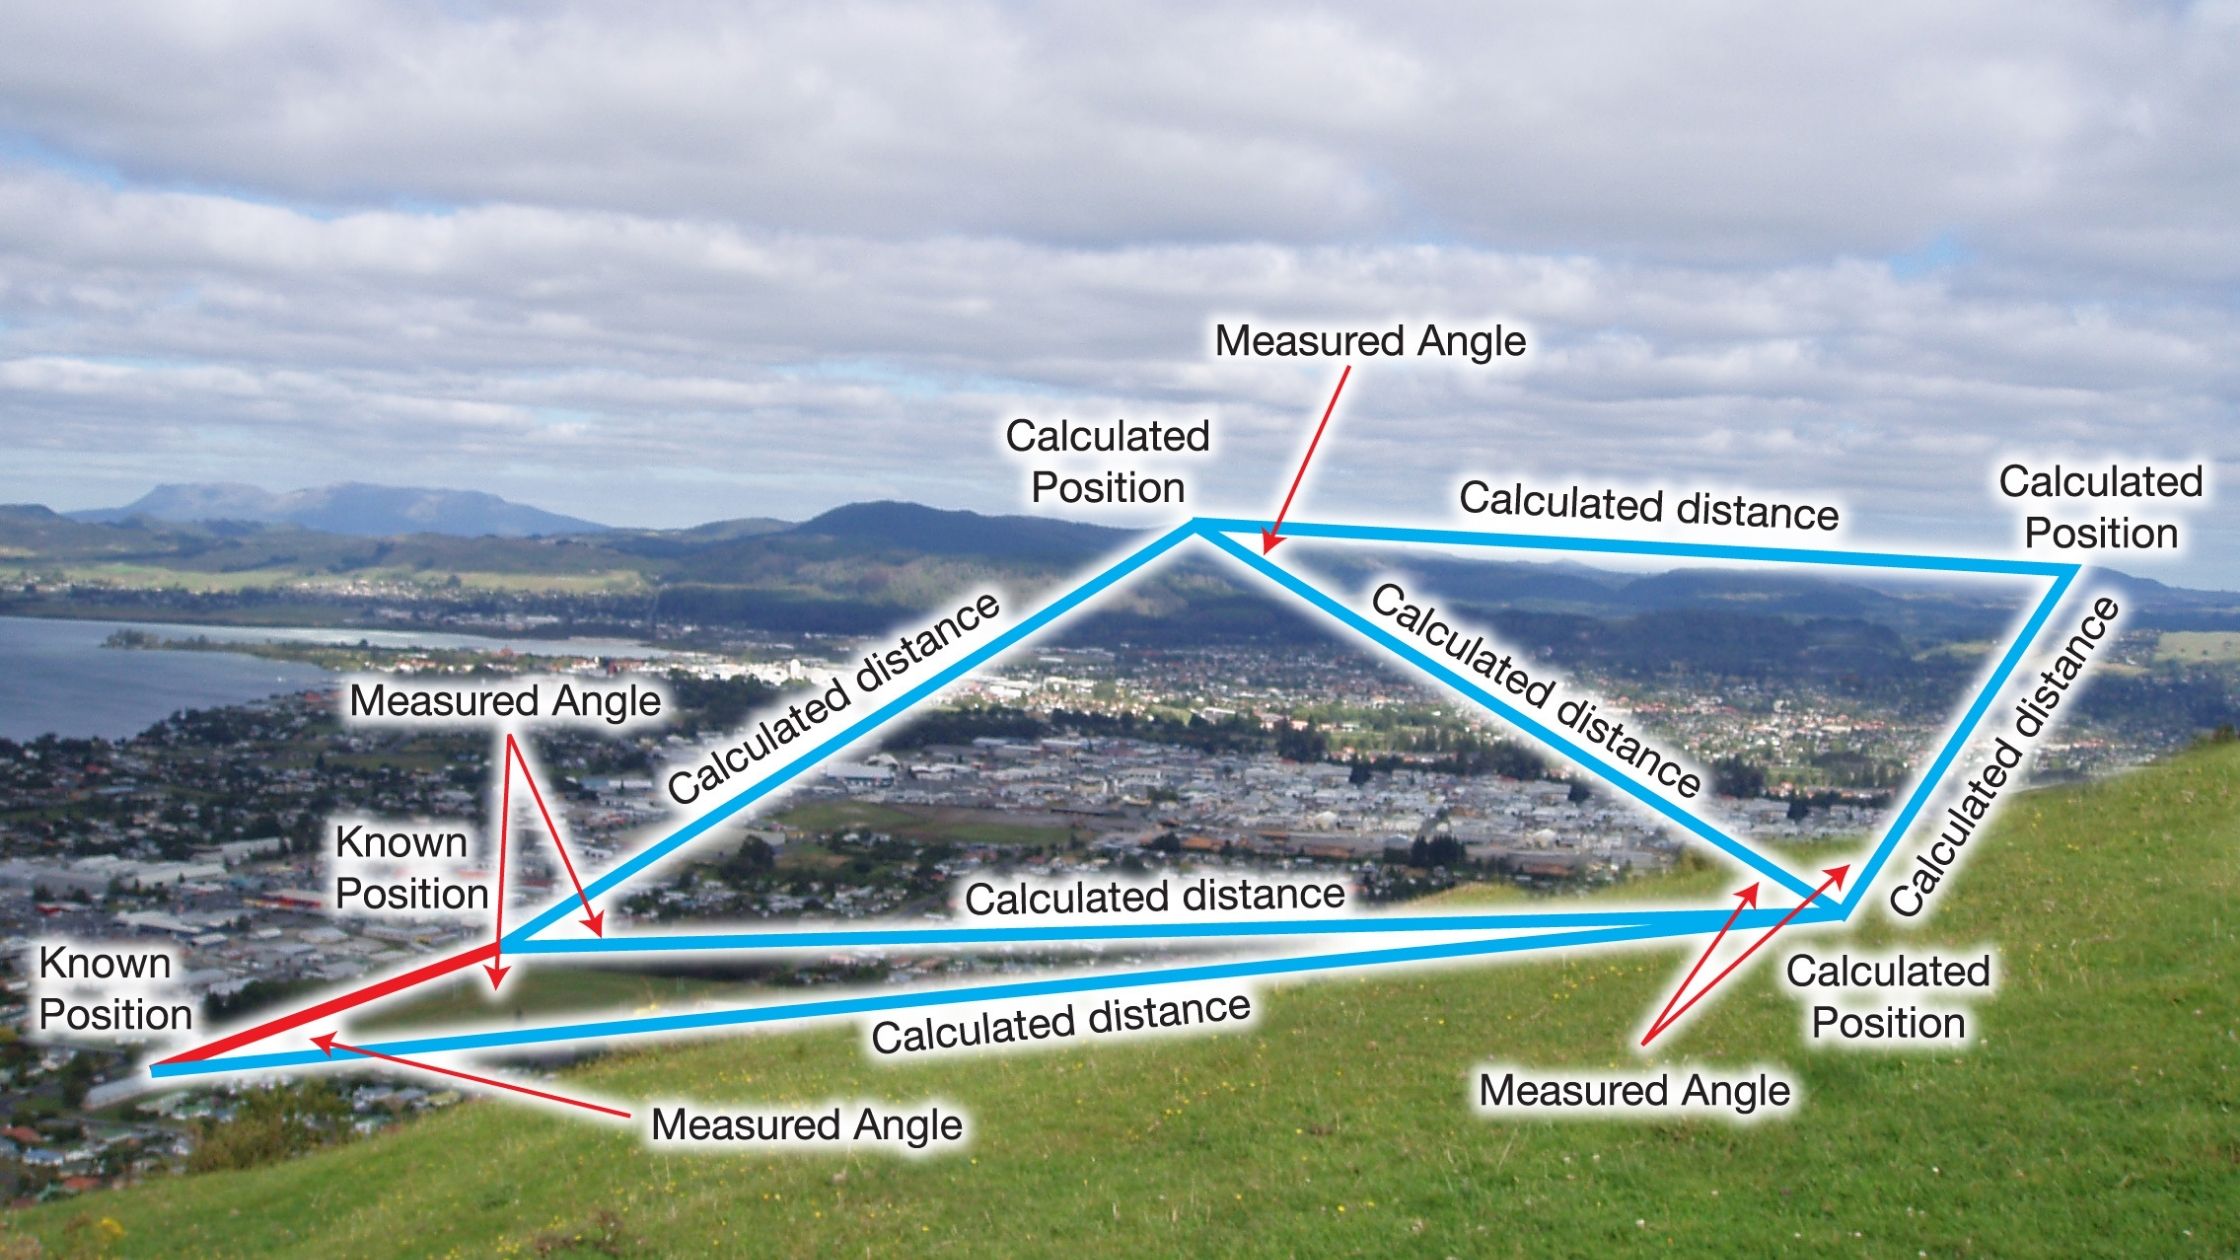
Triangulation Illustration. Source: https://www.icsm.gov.au/education/fundamentals-mapping/surveying-mapping/surveying-methods
clearGRID determines the meter’s location through triangulation. This is because they capture a meter’s Radio Frequency signal from multiple angles in the sky. They then create a 3D map of the Radio Frequency environment, which enables them to plan routes for where they need to be to hear a signal.
“Can you tell me why collecting this kind of data from a plane is a better solution than some of the other solutions that we see out there?” (ODonohue, 2020, 2:27)
‘Walk-by’ and ‘drive-by’ data collection methods are prone to interference, making it difficult to collect all meter readings. In areas with high interference, utility service providers have to collect meter readings manually.
Aerial meter reading is more efficient than the other RF data collection methods because there are fewer objects interfering with the RF signals. This reduces the number of missed meter readings significantly, with clearGRID reporting a collection percentage of 99.5-100%.
And That Is Not All…
Daniel’s and Ellen’s discussion covered many more topics including:
- “I’m assuming anyway, you’re building up this almost like a density map, in terms of signal strength for a given area. And what does that data look like? What can you do with it? Well, that it’s quite a unique data set.” (ODonohue, 2020, 8:57)
- “…do you see any change in that data set over time?” (ODonohue, 2020, 10:16)
- “… does this apply to any sort of utility company? Are you using this In other areas of industry…” (ODonohue, 2020, 12:28)
- “… why a mesh network, why the Internet of Things won’t sort of take this over at some stage, could you talk to them…” (ODonohue, 2020, 15:35)
- “… but we’re going to do that with drones one day, …” (ODonohue, 2020, 17:06)
- “So, when I look at your website, and after listening to you, are you in fact, a remote sensing company?” (ODonohue, 2020, 19:26)
Give it a LISTEN!
We would love to hear your thoughts and experiences regarding the collection of utility meter readings in the comments section below.
_____
Sources
ODonohue, D. (2020). RADIO FREQUENCY DATA COLLECTION. THE MAPSCAPING PODCAST [Podcast]. Retrieved 17 December 2020, from https://mapscaping.com/blogs/the-mapscaping-podcast/radio-frequency-data-collection.
Radio Frequency Data Collection. MapScaping. Retrieved 18 December 2020, from https://mapscaping.com/blogs/the-mapscaping-podcast/radio-frequency-data-collection.
SDG Atlas 2020. Datatopics.worldbank.org. (2020). Retrieved 19 December 2020, from https://datatopics.worldbank.org/sdgatlas/goal-7-affordable-and-clean-energy/.
Carlowicz, M. (2017). New Night Lights Maps Open Up Possible Real-Time Applications. NASA. Retrieved 19 December 2020, from https://www.nasa.gov/feature/goddard/2017/new-night-lights-maps-open-up-possible-real-time-applications/.
IEA, IRENA, UNSD, World Bank, WHO. 2020. Tracking SDG 7: The Energy Progress Report. World Bank, Washington DC. © World Bank. License: Creative Commons Attribution—NonCommercial 3.0 IGO (CC BY-NC3.0 IGO).
Molli, K. (2011). A short history of meter reading technology. Metroplanning.org. Retrieved 19 December 2020
Manual Meter Reads vs AMR | Efficiency Direct. Efficiency-direct.co.uk. (2014). Retrieved 19 December 2020, from https://efficiency-direct.co.uk/blog/manual-meter-reads-vs-amr/.
Monica, Phys & Crainic, Monica. (2012). A SHORT HISTORY OF RESIDENTIAL WATER METERS PART III IMPROVEMENTS OF WATER METERS.
Ali, A. (2013). Smart Grids: Opportunities, Developments, and Trends (pp. 109-110). Springer.
Schwab, K. (2016). The Fourth Industrial Revolution (pp. 13). The World Economic Forum.
Sehgal, A. REMOTE METER READING METHODS OF RETRIEVING DATA BY USE OF REMOTE DEVICES. Asgmt.com. Retrieved 20 December 2020, from https://asgmt.com/wp-content/uploads/pdf-docs/2004/1/C8.pdf.
Automatic meter reading. En.wikipedia.org. Retrieved 20 December 2020, from https://en.wikipedia.org/wiki/Automatic_meter_reading.
Roche, J. AMR vs AMI – POWERGrid International. POWERGrid International. Retrieved 20 December 2020, from https://www.power-grid.com/smart-grid/amr-vs-ami/#gref.
Smart meter. En.wikipedia.org. Retrieved 20 December 2020, from https://en.wikipedia.org/wiki/Smart_meter.
Harwood, M. (2009). Factors Affecting Wireless Signals | Network+ Exam Cram: Wireless Networking | Pearson IT Certification. Pearsonitcertification.com. Retrieved 20 December 2020, from https://www.pearsonitcertification.com/articles/article.aspx?p=1329709&seqNum=3