
After consecutive hurricanes carved their way through the Gulf of Mexico in August and September of 2017, of paramount importance was restoring the crippled utility infrastructure. This wasn’t just a matter of getting the lights back on in time to catch Doctor Who. For some, it would be a matter of life and death.
But with power lines strung across thousands of acres, many of which were either densely vegetated or flooded, conducting mass inspections with ground teams would be next to impossible. That’s when lidar-equipped drones hit the skies.
The UAVs were able to survey flood-ravaged land and collect infrastructure maps detailed enough to visualize power lines. The structural integrity of cell towers was assessed and ground teams were dispensed accordingly to restore communications where they were most needed. Had the hurricanes hit ten years earlier, the recovery process would have looked far different.
A Brief History of Lidar
Lidar (a portmanteau of the words light and radar; radar being an acronym for “RAdio Detection And Ranging, hence the confusion regarding whether lidar is an acronym) has actually been around in its simplest form since shortly after the invention of the laser in the 1960s. The fundamental concept works much like radar in that it identifies the location of objects by sending out electromagnetic waves and measuring the amount of time it takes for reflections to return to the sensor. But instead of operating in the radio or microwave wavelengths, lidar operates in a little neighborhood of the electromagnetic spectrum known as light.
While the technology has existed for some time, until recently one would have needed a budget resembling that of a ballistic missile program to get their grubby hands on it. The systems have traditionally cost upwards of hundreds of thousands of dollars and primarily been deployed from manned aerial vehicles, making the scope of their application limited to large scale operations.
The cost isn’t surprising. In addition to high resolution laser rangefinding sensors, mobile lidar systems must employ inertial navigation systems integrated with GNSS receivers to compensate for the immense complexity motion introduces to the measuring process. Measuring laser light reflections while bobbing around in the air could be likened to playing an intense game of racquetball on a trampoline; it takes a lot of coordination. But the results are worth it: three dimensional cartographic models of unrivaled precision that can be collected quickly and independently of natural lighting conditions.
Lidar + Drones = A Match Made In Cartometric Modeling Heaven
A recent offering like the Velodyne Puck LITE lidar sensor comes in at a mere 600 grams and can be had for well below ten thousand dollars. The size and weight is intended to be mountable to a platform like the DJI Matrice 600 Pro. With costs dropping to accessible ranges and lighter weight payloads that can now be deployed from a drone, an entirely new industry is beginning to open up. Already, lidar-equipped drones are being deployed for agriculture, surveying, construction projects, infrastructure maintenance and even hydrographic analysis of ski slopes for assessing avalanche conditions.
A Promising Future
The economic and environmental benefits are manifold. According to a report by the World Bank, approximately 1.3 billion tons of solid waste are generated every year by the construction industry alone. However, a large amount of this waste can be prevented if construction managers are better equipped for resource management. One of the most exciting uses of lidar-equipped construction drones is volumetric analysis of material stockpiles. Aerial volumetric analysis makes it possible to quickly survey material stockpiles scattered throughout a jobsite and calculate their volumes precisely. This is not only promises to reduce landfill bulk and waste, it reaps an enormous cost savings. This means you can expect the construction industry to soon become a big customer for lidar-equipped drones as project managers need little incentive to save more time and money.
Other industries under the eye of drone-deployed lidar include high tech agriculture, forestry, flood and hydrographic modeling, mining and even video game map generation. While photogrammetry can do many of the same tasks by comparing overlapping images to make educated guesses at altitudes, lidar remains king when it comes to precision due to it’s truly 3d data points. These data points are combined into a “point cloud” which, aside from providing precise data for the aforementioned industries, looks pretty darn cool.
Point Cloud Samples
Not ones to tease, we thought it would be cool to show you a few point cloud samples that you can play around with yourself right from the comfort of your browser.
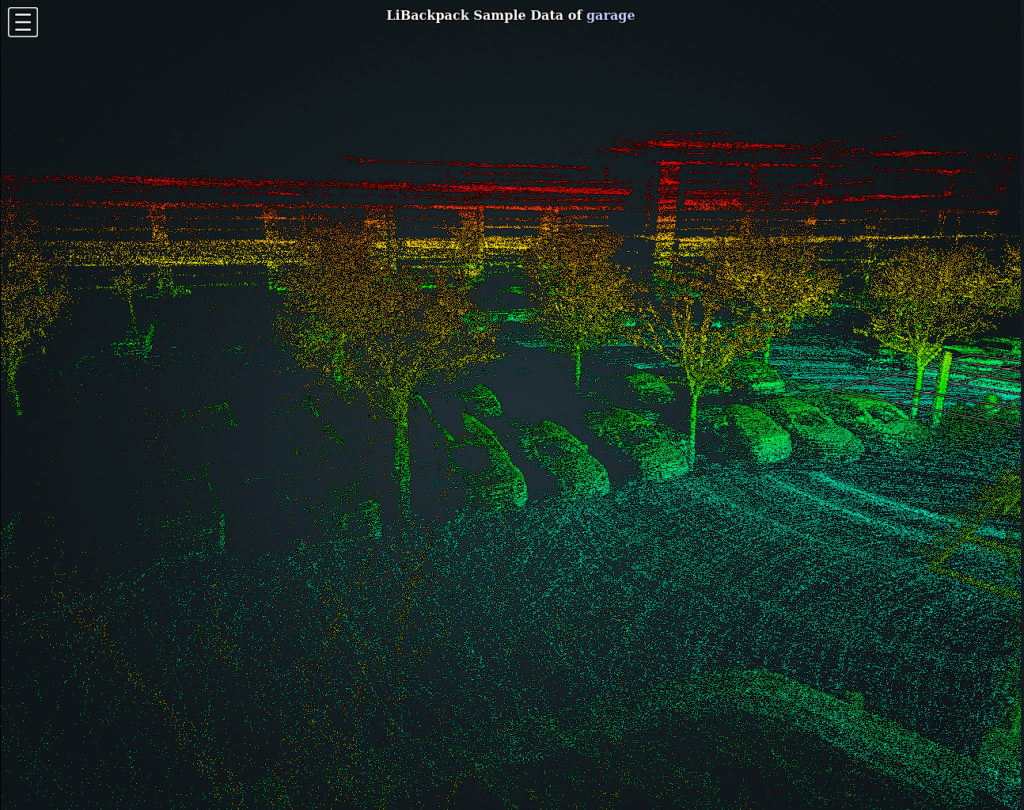
Image courtesy of greenvalleyintl.com
Green Valley International offers several interactive lidar clouds including an empty sand barge, some interesting terrain, a color-enhanced suburban neighborhood shot from overhead by a helicopter and an interesting parking garage. Zoom your way into the interior of the parking garage by double-clicking where you want to fly and you can just about make out the model and manufacturer of the cars parked inside. Or snoop around a map of apartment buildings on the outskirts of a city. The forest map looks hard to read at first but up your pixels budget (which trades speed of rendering for more data) and tweak the elevation range to alter the color spectrum across point elevations and you’ll find the ground is surprisingly well-defined underneath all of those trees.
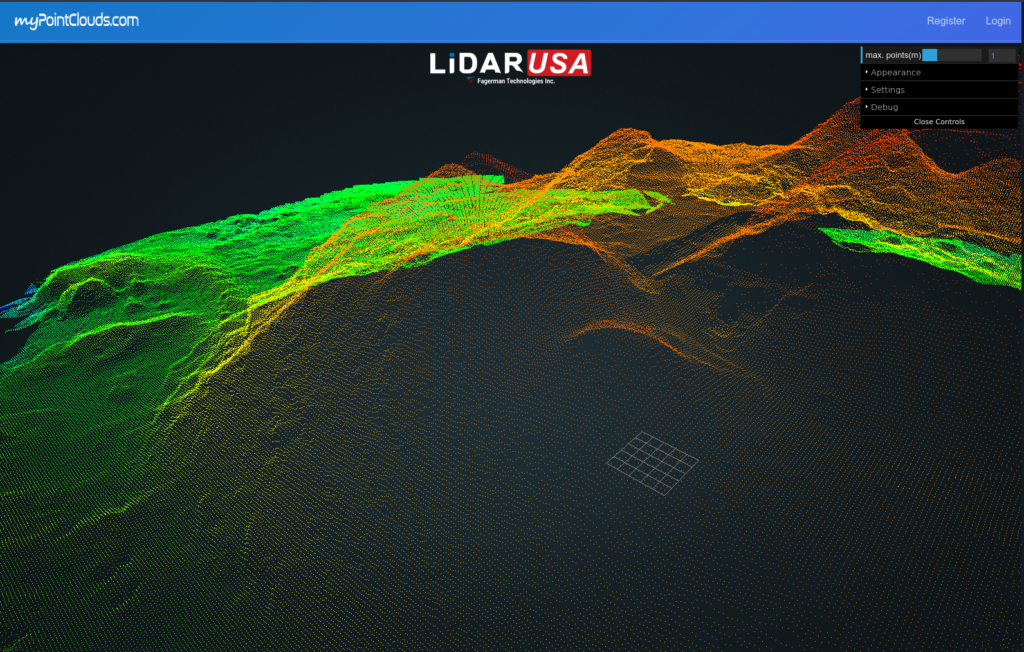
Image courtesy of mypointclouds.com
Lidar USA, via MyPointClouds.com, features an agricultural topographical map, transmission lines, a colorized city structure map and, perhaps most interestingly, the Mayan La Danta temple. Their mysteriously-named map called “building” looks super cool when you turn the opacity down a touch.
Under the “Materials” dropdown you can turn on elevation mode and see details that were previously hidden pop out in the resulting color spectrum. This makes things like vehicles and irregularities in terrain more identifiable. (Did you notice the tank and helicopter before you turned it on?) Switch to one of the RGB-value maps and try flipping between elevation and RGB in the Materials dropdown and see what you missed before.
The reason these settings are on every map is because every point cloud starts life out monochromatically. Rangefinding sensors detect only distance as it is measured from the reflection of pulsed laser light, and so color has to be blended in with a little assistance from conventional cameras. RGB values make it easier to understand what you’re looking at but aren’t always available. But elevation will always be available as it is an inherent aspect of lidar’s uniquely 3-dimensional data (as opposed to 2d maps, which forces human eyes and photogrammetry algorithms to make inferences about elevation).
To take advantage of this, the lowest levels on the map show up as blue and quickly shift to green, yellow and red respectively as the elevation increases. Because the coloration spectrum is relevant to the elevation gradient that it encompasses, you may want to tweak the “elevation range’ setting to limit the range to relevant levels. Tightening up the spectrum allows you to see increased detail at a range of interest.
Surveying the Future
With the technology just beginning to reach peak acceleration, you’ll be sure to see it cropping up in more areas in the coming years. Hopefully these samples give you an idea of what drone-deployed lidar has to offer for the cartography world and its related industries. Keep an eye out for more updates on Geoawesomeness soon.


#Business


Next article


For the first time ever, scientists are leveraging high-resolution satellite imagery and advanced analytics to create an accurate global mosaic of the world’s coral reefs. With this innovative approach, the Allen Coral Atlas aims to have all the world’s coral reefs mapped at 3.7-meter resolution by December 2020.
The initiative brings together partners from Planet, Carnegie Institution for Science, Arizona State University in partnership with the University of Queensland, and National Geographic Society. Each of these players has a crucial role in sifting through the remotely-sensed data to determine what is and isn’t a coral reef and to determine how the knowledge can be used to inform coral conservation.
The technology behind Allen Coral Atlas: Explained
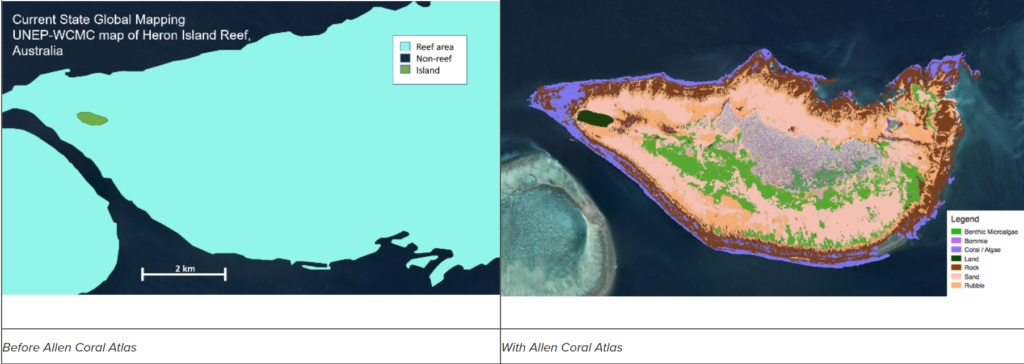
Planet’s satellite imagery data is the starting point for creating coral maps. Using the United Nations Environment Programme (UNEP) 2010 Coral Layer as the reference, Planet captures imagery with 3.125 m pixel size. It should be noted that the Atlas is mapping only tropical shallow coral reefs, between 30 degrees North and South of the equator in depths shallower than 10m for benthic composition and up to 20m for geomorphic zonation – given the physical limitation of the satellite image data.
Once Planet has cleaned up the raw data with a number of processing techniques, it is passed on to the Carnegie Institute. There, the science team corrects the data for issues like atmospheric effects, waterbody detection, sun glint removal, depth calculation, and bottom reflectance estimation.
After this, it is over to the researchers at University of Queensland to classify the different coral reef environments by leveraging the models developed by the Center for Global Discovery and Conservation Science (GDCS) at Arizona State University. Machine learning algorithms use the principles of Object Based Analysis (OBA) to create highly efficient and accurate maps, incorporating attributes like global wave climate model, water depth, slope, etc., along the way.
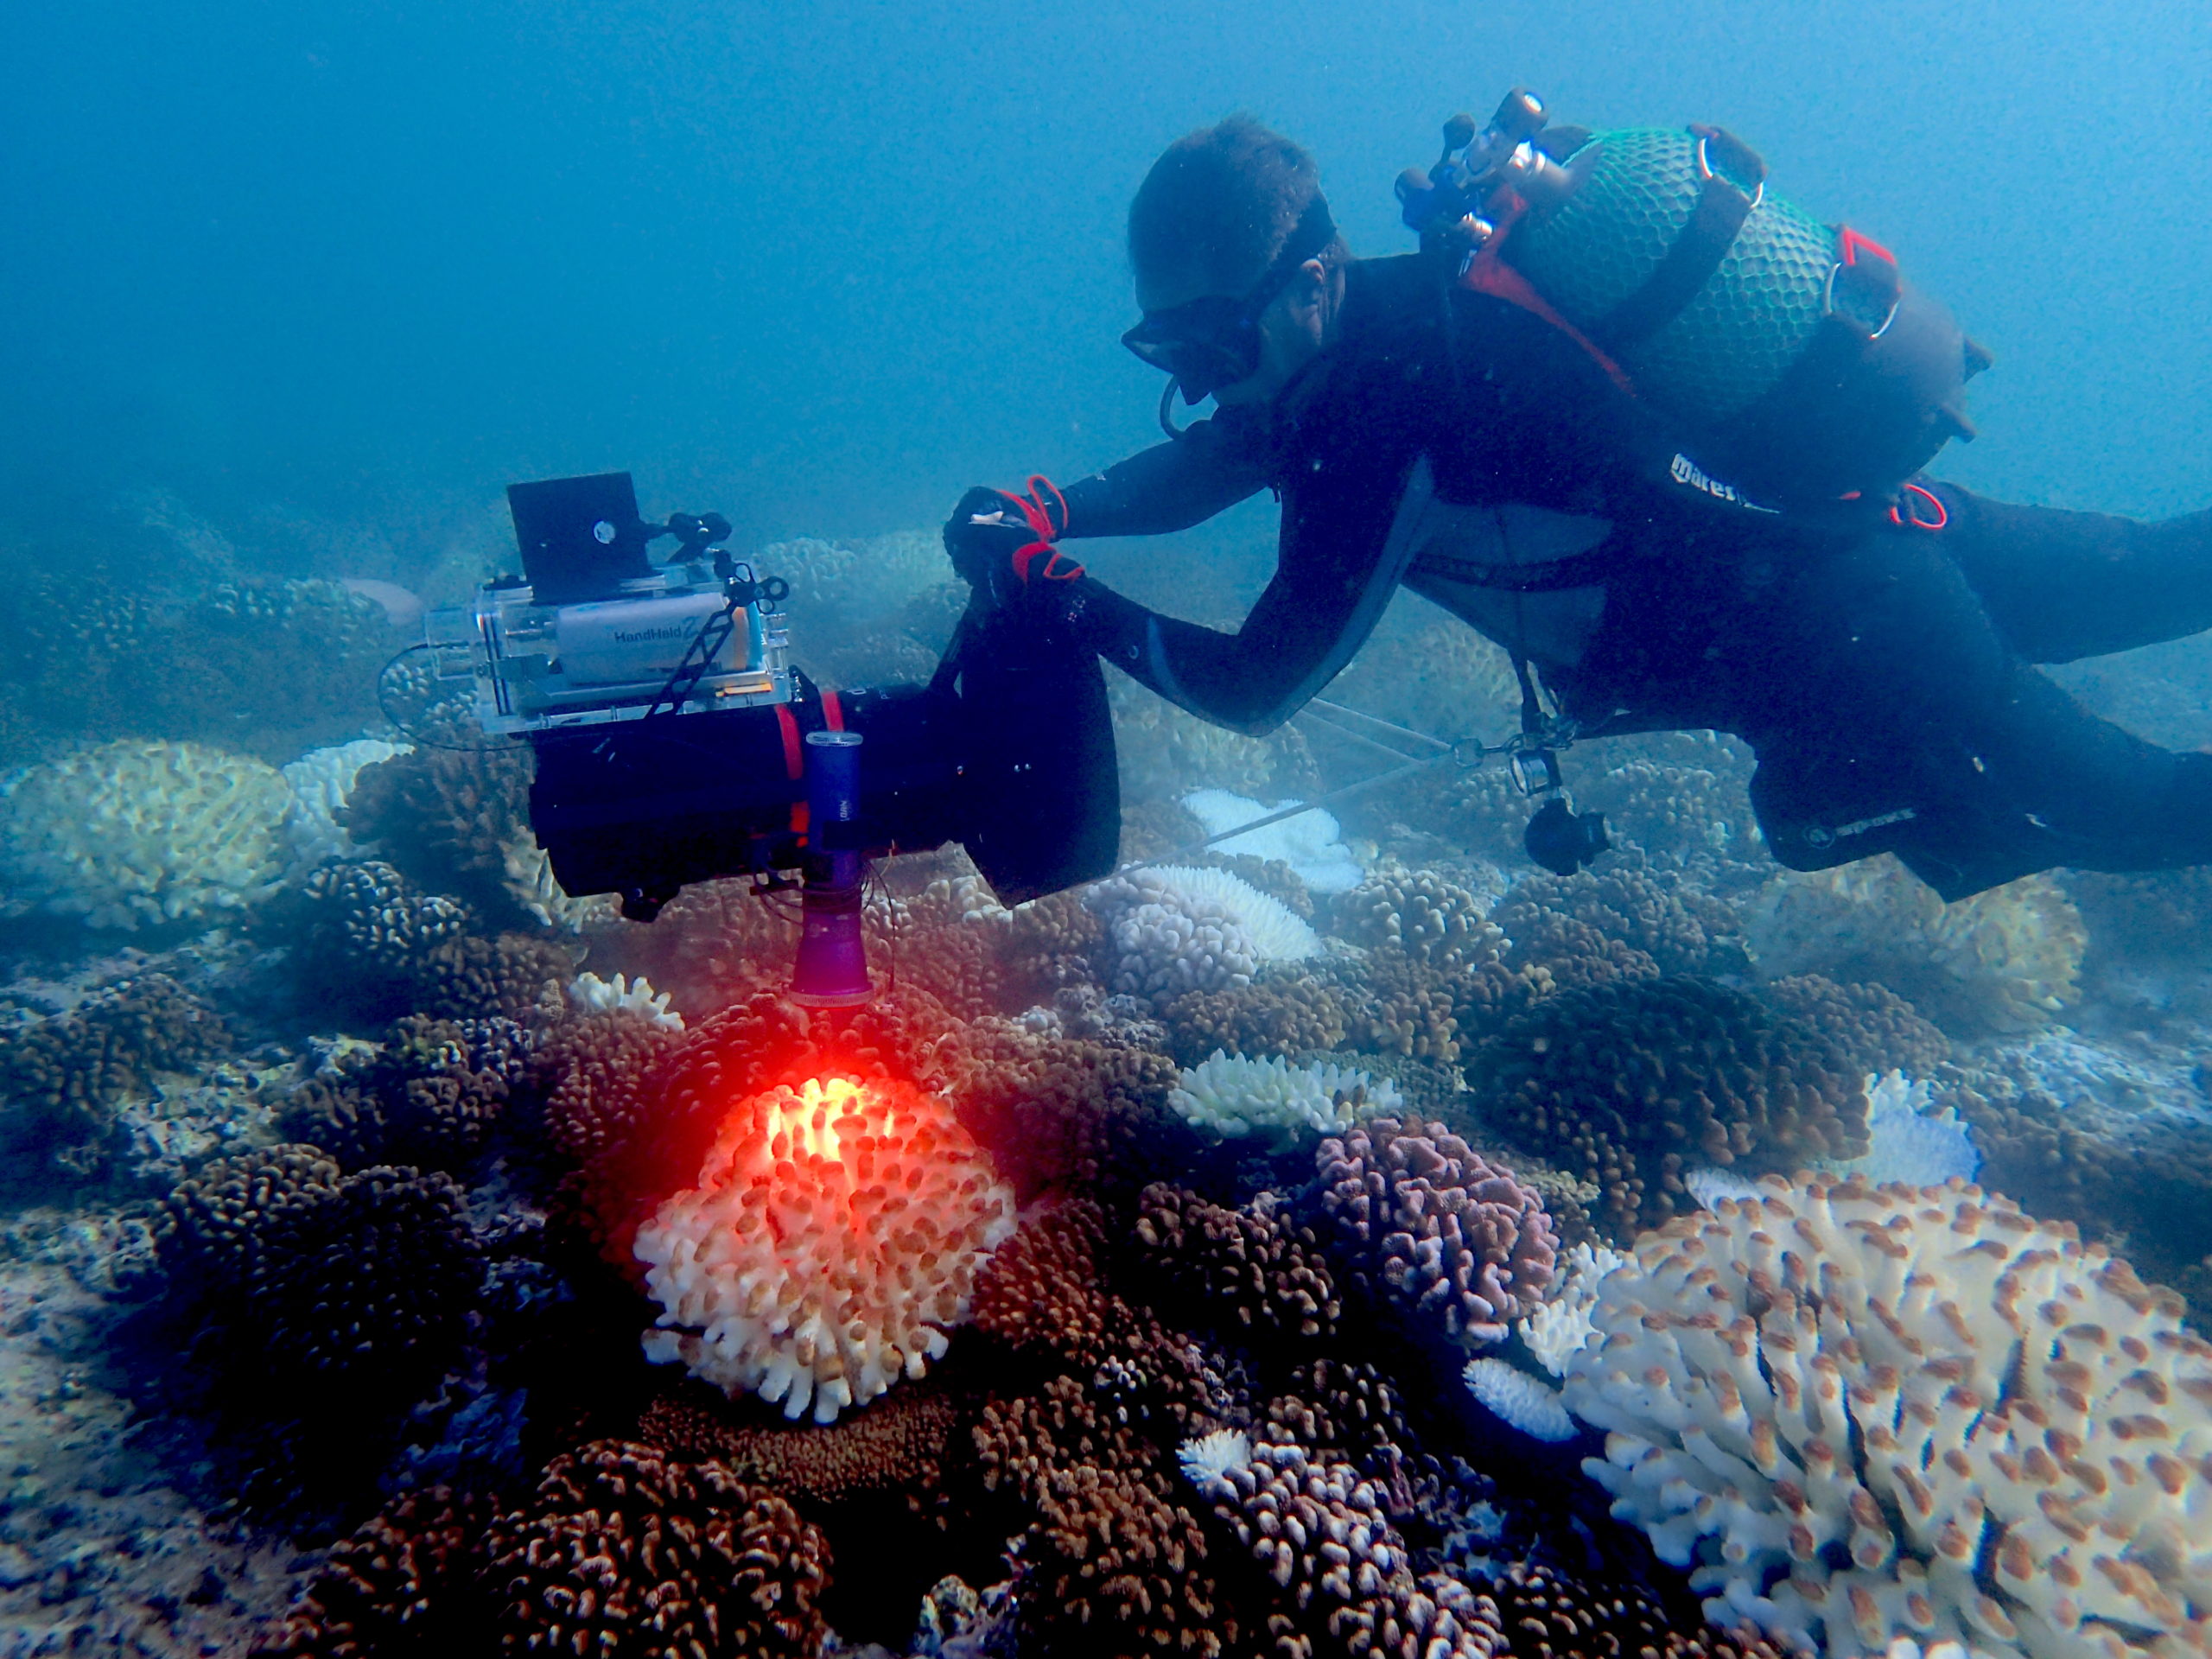
Once the maps are created, the National Geographic Society sends field teams to collect geo-referenced data in selected regions to help test, develop and implement the mapping algorithms. But on a larger scale, its focus is to build awareness and understanding about the Atlas so it can be leveraged globally by the users and help government coral monitoring and mapping programs.
Earlier this year, the Allen Coral Atlas integrated Coral Reef Watch data on sea temperature trends from the United States National Oceanic and Atmospheric Administration, allowing Atlas users to add sea temperature visualizations on demand. The Atlas will continue to add features and capabilities in the future as well.
Explore the Atlas here.