
Changing with the times, the curb is no longer just the elevated edge along the side of the street. It is now used to describe an intermediate zone alongside a road, including transit bays, street parking, “flex zones”, valet lanes, bicycle lanes, Transportation Network Company (TNC) pick-up and drop-off areas, or commercial loading zones. The evolution of transportation technologies, infrastructure, and mobility tools means that the curb is increasingly important. As a result, the curb can—and should—be inventoried and mapped. This raises inevitable questions for OpenStreetMap: how do you manage and map the diverse uses of the curb, with specifics pertaining to size, usage, and time restrictions?
The OpenStreetMap Wiki contains a few entries for “curb” (mainly correcting to the British spelling, “kerb”) This includes Key:kerb, which is defined as the edge where a road meets a sidewalk . The entry goes on to state:
As these are transition points between different surfaces and/or elevations, the locations of kerbs are important features to pedestrians, cyclists, and especially to those with reduced mobility (e.g., in wheelchairs)
In this case, the curb is meant to be mapped as a node in a way, like the point where a sidewalk crosses a lowered or flush curb and becomes a marked crosswalk. This is the curb as a point, in one dimension.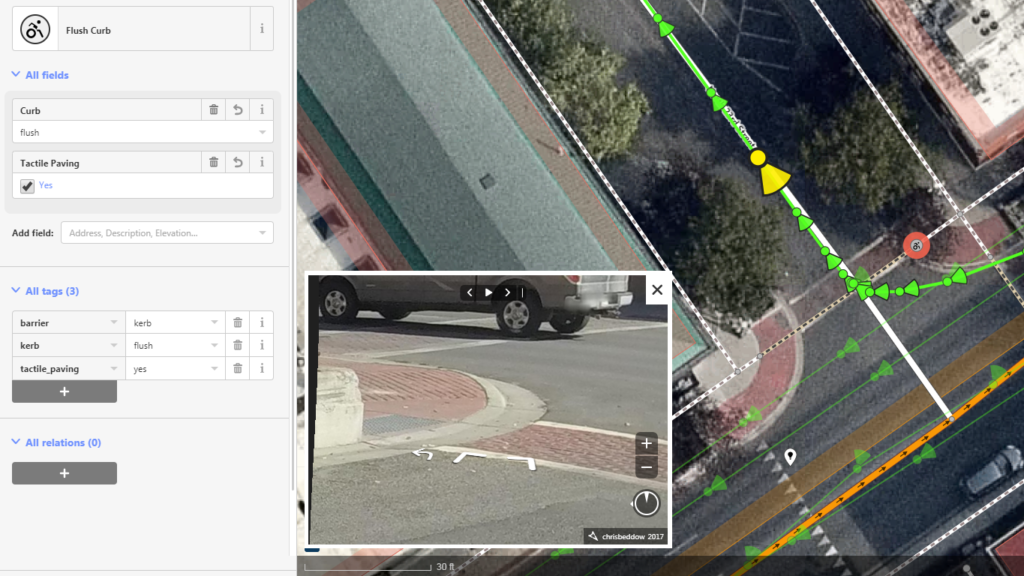
Meanwhile, the Tag_barrier=kerb entry on the wiki describes the curb as a line, but with a third dimension as well: height. The entry is very brief, and mainly consists of the following:
…barrier=kerb is a barrier for vehicles and wheelchair drivers. The height of the kerb is important and with this information, the usage by different groups can be determined. The height of the kerb is tagged additionally as height=*, if available. Right side is bottom, left side is top.
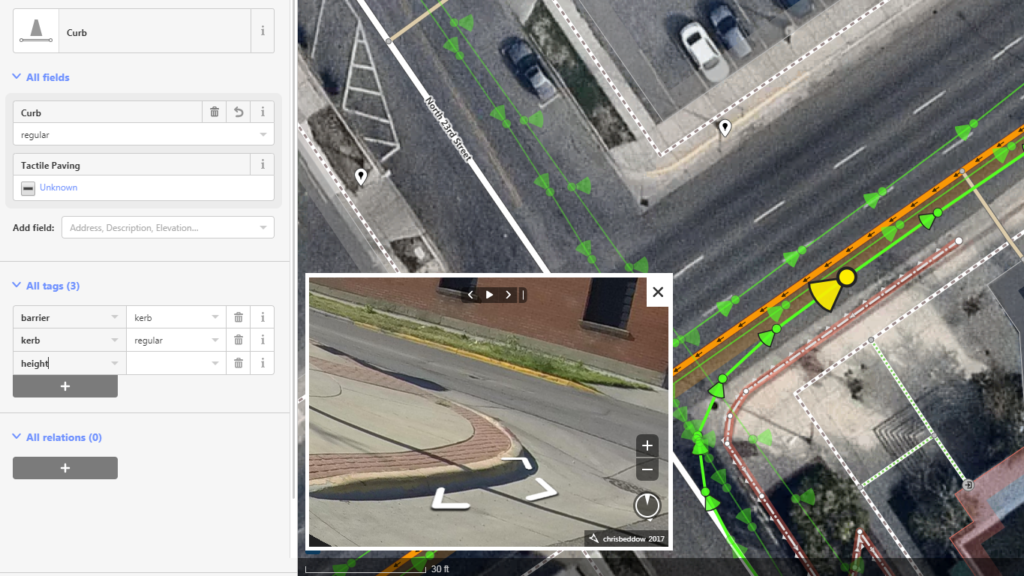
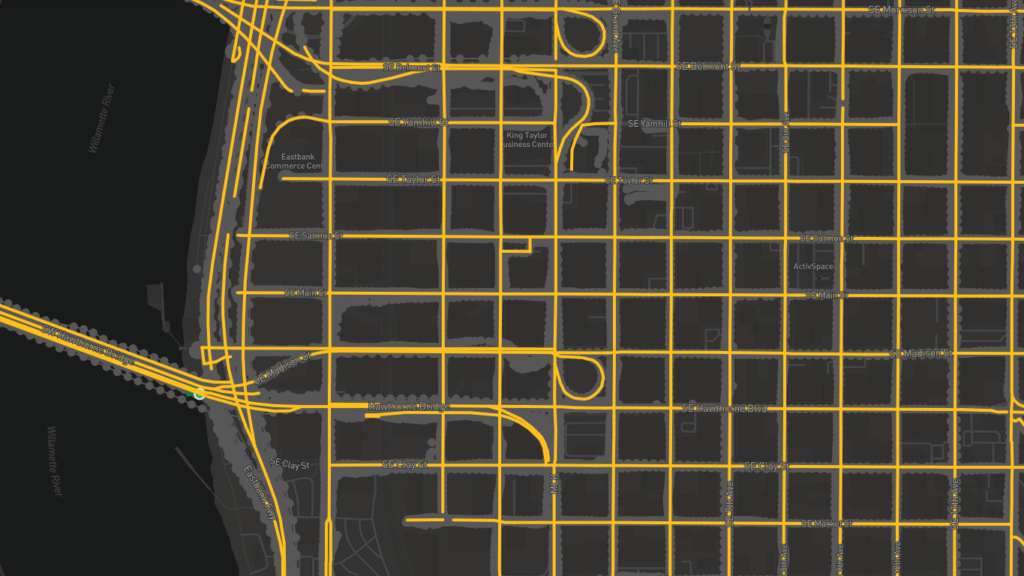
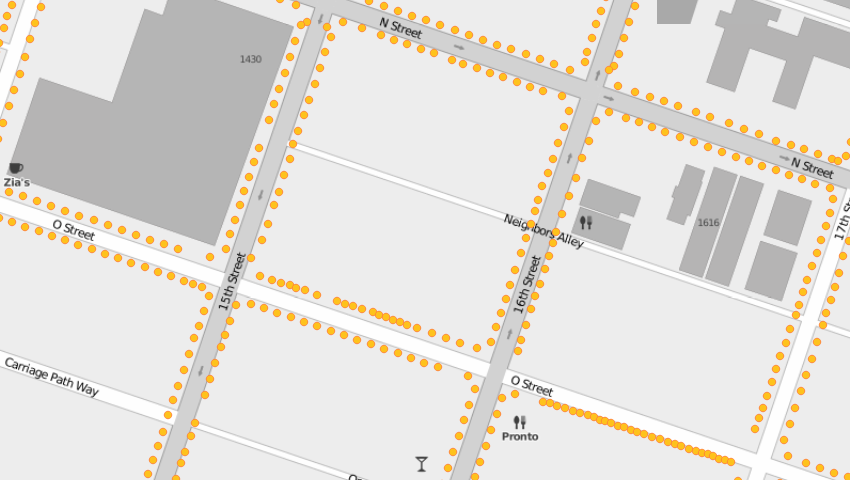
This is the beginning of the curb as a discrete feature on the map. Using OSM iD editor in a downtown area, we can spot a curb in the nearest Mapillary image, then follow the curb outline using Digital Globe Premium basemap. It can be marked as a regular curb, while it’s not certain if the brick edge counts as tactile. When noting the height, there’s a clear need to physically measure the particular curb. This curb and the one across the street are both yellow, indicating no parking is allowed—but there’s currently no way to indicate this in OSM.
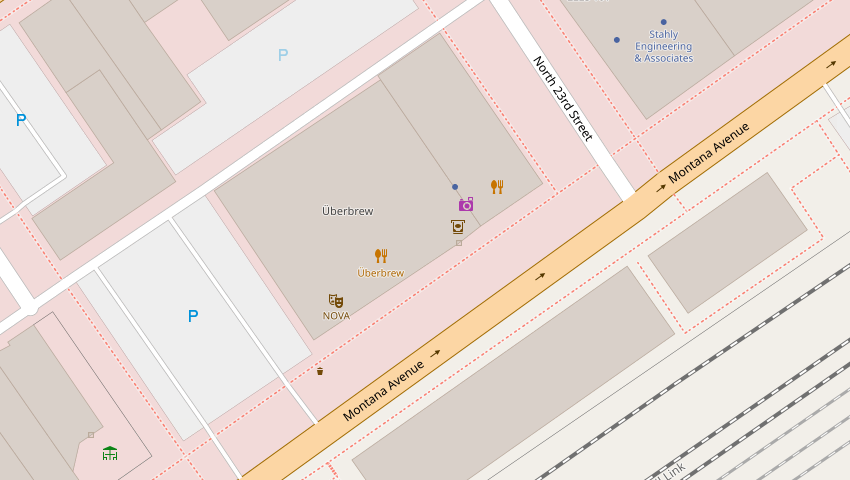
Examining the OpenStreetMap base layer, it’s easy to see how much detail is missing compared to a satellite map. Mapillary images are a reminder of how much rich detail is on the ground when doing some armchair mapping. And of course, if you’re on the ground, whether out for a walk, driving and parking a vehicle, or cycling just beside the curb, it’s obvious that the map isn’t very detailed about the “spaces in between”. In other words, there is a significant amount of information missing. When a machine needs to access map data—whether a routing service using the Overpass API, or a hypothetical autonomous vehicle—the OSM database is simply not very informative about the curb.
 There are ways to demarcate the diverse uses of a static location within OSM, such as through the use of “conditional tagging” such as parking:lanes:conditional. This, however, limits the mapping of the curb to adding conditions to existing line segments, in this case, lanes on the street. But, how do you map an actual polygon that emphasizes the dimensions of a specific curb space, and where do you then provide descriptions of its diverse uses? For example, two vehicle zones may serve as residential parking at nighttime, but function as TNC drop-off and pick-up zones as well as loading areas for deliveries during the day. Perhaps that whole zone additionally functions as a bus lane during peak hours in order to control congestion.
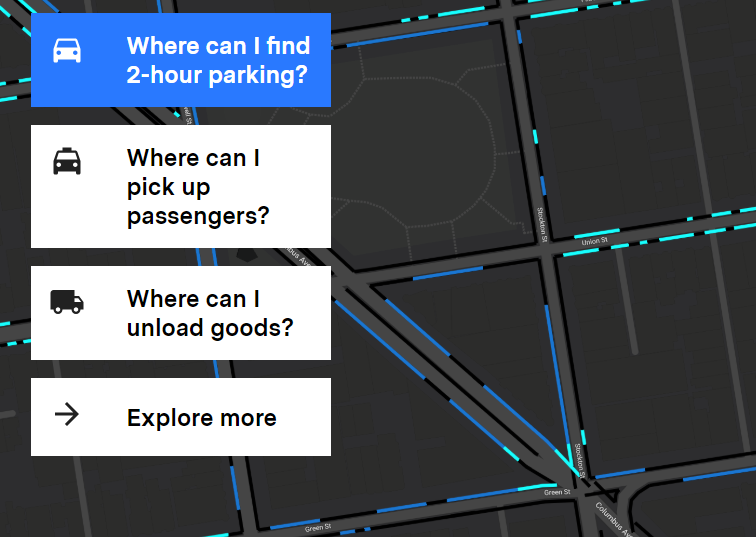
These are merely a few of many examples. The fact that OpenStreetMap has failed to embrace the curb is important for the entire OSM community. If this continues, another platform will inevitably take the lead. Mapping the curb is already becoming a game changer, seen for example in such cities as Los Angeles and San Francisco where Coord, powered by Sidewalk Labs, helped put intricate details of curb classification and regulations into an API that can empower applications that need to get information about the curb at a given longitude and latitude. While this data is painstakingly collected in order to be accurate and precise, curb data is also collected through more automated methods such as Mapillary’s computer vision, which intelligently detects and classifies curbs in street-level imagery.
Collecting the data is a massive challenge, but organizing, analyzing, and sharing it is just as daunting. SharedStreeets is pioneering an open standard and data exchange for road network information, geared toward increasing private and public partnerships when sharing such data as curb regulations. Meanwhile, Remix specializes in helping cities to understand private data when enforcing regulations and planning policies. But why are we not doing this via an open platform, such as OSM? Most, if not all of this is happening in parallel to OpenStreetMap, rather than in collaboration. Where do these paths cross, between open public data, privately collected data, and the world’s decentralized, yet standardized open map (or database)?
The power of OSM is in its function as a map that can be commonly contributed to as well as commonly used. Having the ability to map the curb with tools improved and standardized by OSM, with the curb as its own tag and polygons specified certain curbside uses, would adopt the wonderful world of open source mapping into the rapidly changing present and future. Maps are certainly changing as technology evolves, and as maps are used less for human navigation than for machine navigation, their purpose needs to not shift but to expand. As Justin O’Beirne wrote in a 2017 analysis, “we’ll start caring more about the macro than the micro”. This indicates a shift in how humans read maps, yet while we are looking for POIs our transportation mode will be looking for the micro-level details that we don’t need to consciously consider as map consumers.
So, the question remains—will OSM embrace the curb? If OSM is to remain a map for humans, which it very much is, then the macro-level is sufficient. OSM’s status as the best map of the world, however, calls for unifying these macro and micro details together in a database of everything in the physical world—for humans and our machines. In order to achieve this, the question should be extended: how will OSM embrace the curb?
By Daniela Waltersdorfer J (@DWaltersdorfer), Transportation Analyst at Cambridge Systematics, and Christopher Beddow (@c_beddow), Solutions Engineer at Mapillary.


#Ideas


Next article
Meet PlanetWatchers – the startup that provides geoanalytics as a service for natural resource management

For many decades now, Remote sensing and geospatial analytics have been used to monitor natural resources. In fact, natural resource and environmental management are the key objectives of the longest serving Earth Observation program in the world – LandSat.
PlanetWatchers, a Tel-Aviv based startup is now transforming the way large enterprises monitor their natural resources assets with their monitoring platform; filling the analytics gap and reshaping the way enterprises are managing geographically distributed natural resources. Had the pleasure of chatting with their co-founder Ariel Smoliar to learn more about their vision, business model, technology and his team. Read on!

PlanetWatchers Team
Q1: Ariel, thanks for taking the time. What were you and your co-founder Roi working on before you started PlanetWatchers? You were working as a Captain for the National Geospatial-Intelligence Agency of Israel, right? How was that experience?
Roi and I are alumni of elite Israeli military Intelligence units. We first met twelve years ago when we collaborated on a project using AI to perform large-scale detection of man-made objects (anomalies) using multispectral satellite imagery. After my military service, I worked in big data startups in Silicon Valley and Roi was part of a startup that was providing analytics services leveraging various remote sensing data sources to the global forestry and agriculture industries. Shai, who joined PlanetWatchers to lead operations, comes from a supply chain background. When Roi and I started PlanetWatchers we implemented the fundamentals of imagery analytics that we learned during our collaboration, Roi’s remote sensing expertise and deep use case understanding and merged this with my background in cloud computing and machine learning.
Q2: So you guys must have had a good life working in Silicon Valley. When did you and Roi decide to start PlanetWatchers? What made you take the leap of faith to take the plunge into entrepreneurship?
Satellite imagery analytics is in our team’s DNA. When Roi and I saw all the excitement of new technologies emerging as part of the New Space Revolution, we felt it was time for us to do satellite imagery differently. This is in stark contrast to the generalist companies in the analytics space because we brought our expertise and enthusiasm to a global scale to serve enterprises who were used to purchasing raw data from the satellite imagery providers. We provided a new type of analytics as a service. As new data sources started to become more commercially available, we wanted to lead the change and ensure these technical data sources were properly utilized.
Q3: PlanetWatchers was started to help enterprise companies better manage their geographical distributed natural resources (e.g. forestry, agriculture, oil & gas among other things). Could you tell us a bit more about what kind of analytics you deliver to your clients and how they benefit from it?
PlanetWatchers has built the world’s leading risk management and analytics platform. The whole premise of PlanetWatchers’ proactive monitoring and analytics is that it enables users to get a complete picture of their distributed natural resources in any location on the globe at the monitoring frequency that they need. For a long time we worked on how best to combine the multitude of satellite data sources in a meaningful way that would add value to the owners of large-scale assets and we believe we nailed it.
The big issue with this ecosystem at the moment is that no one else is performing root cause analysis; sampling cars in all the parking lots in the U.S. might tell about the retail industry but does not provide details about why changes are happening. Similarly, counting energy infrastructure to estimate oil supplies can provide an updated volume assessment of global oil reserves, but it does not show where this oil is traveling or how much is being withheld from the supply. Lastly, sampling virgin rainforests to estimate the amount of deforestation occurring will help to create more transparent supply chains, but when PlanetWatchers monitors a forest, we can tell exactly when and how much biomass is lost over time and where new threats are popping up. Here at PlanetWatchers we provide root cause analysis; we monitor the entire area of interest and provide meaningful insights, risk assessment and recommendations on how to best mitigate risk.
Q4: How did you find your first customer? As a startup, your target audience is big enterprises with geographical distributed assets, was it difficult to convince these big companies to trust a startup? Were you worried that these companies could take your idea, assemble a team of geospatial experts and build their own solution?
When we pitched our monitoring vision to our first customer, we heard their surprise when we offered to reliably and consistently monitor their assets on a monthly basis. They used to capture an optical image once every few years and never imagined the technological feasibility of PlanetWatchers’ platform. We reached out to our first customer thanks to Roi’s previous working experience globally. When we pitched our solution to a large energy company, they told us that they have seen dozens of remote-sensing solutions, but none are capable of packaging all the required space information and make it actionable for the teams in the field.
We do not compete with internal experts but integrate within their workflows and improve collaboration. In addition, we managed to bring together experts in geoanalytics and form a unique and all-round team to build the platform. Talent in SAR imagery analytics is scarce and having experts from multiple disciplines working together building a SaaS solution is not trivial in our space, so we are not worried about these companies trying to assemble a similar team and we are always willing to improve collaboration.
Q5: PlanetWatchers is one of the few startups that utilizes Synthetic Aperture Radar (SAR) data in your processing. Could you tell us more?
PlanetWatchers is the first startup to leverage radar imagery on large-scale asset monitoring. We have chosen radar imagery to be our main data sources for our change detection algorithms for three main reasons: (1) weather insensitive, (2) sensitivity to structural changes and (3) moisture content of the target of interest.
Synthetic Aperture Radar (SAR) is a highly technical data source. It is an active sensor, which means that electromagnetic radiation is emitted from the satellite and the signal that bounces off the Earth (and our targets of interest) provides extremely valuable information related to texture, moisture and composition. This differs from passive sensors, such as optical imagery (think Google Earth/Maps), which relies solely on the light reflected from the Earth. Additionally, the technicalities of SAR are such that imagery may be collected through clouds and even at night!
What makes PlanetWatchers unique is that our team has a strong combination of SAR and optical imagery, remote sensing, big data analytics and domain expertise. We have been focused on developing vertical specific solutions, first in forestry, by partnering with an industry leader (see our case study with Airbus) to solve high value problems with actionable insights that enterprises can use in the field. Then leveraging the approach and change detection capabilities into other natural resources verticals where using AI to monitor change at scale is highly valuable. i.e. oil & gas, mining, agriculture and insurance. All of this development was performed on SAR data, which means we are the only firm capable of end to end analysis and insights on this data source.
Q6: You offer Analytics as a service to your customers. As a geoanalytics startup, how did you come up with the subscription rate for your customers?
Our analytics provide everything our users need to know about their monitored assets. With pinpoint accuracy and constantly updated data, our users are offered a subscription rate based on a variety of parameters such as frequency of data updates, number of acres/hectares monitored, and which applications in our cloud-based platform are necessary.
The exact subscription rates depends on each user, for example, a forestry company might only want data updates once a year but on millions of acres while an energy company might want data updates every several days but only on thousands of acres/hectares. The beauty of our automated solutions is that no matter the use case, we can have it up and running in no time and adding value to users all over the world.
Q7: Using satellite analytics to monitor diverse natural resources must have been quite a challenge. What was the biggest engineering challenge in building such a platform?
A: Our main challenge that keeps us awake at night is understanding the pain points of our customers, who have been used to purchasing raw satellite images and provide them with actionable insights as a service. On the technology side, developing robust and reliable change detection in natural phenomena and obtaining relevant field data to train our AI models is the team’s mission. Coming up with a cloud platform that supports great change detection capabilities is not trivial and that is why we formed an all-round team from all the geospatial disciplines for that mission.
Q8: Could you tell us a bit more about your tech stack? What programming languages and technologies does your team use?
We dedicate a significant time in our product development process to make sure that we provide an intuitive user interface to our customers and they do not need to spend time learning how to interact with the applications. The web interface is built with React and Node.js for the backend support. We are running on AWS and leveraging multiple services and selected MongoDB to support our data pipeline.
[Read: Choosing the right database for geoanalytics]
Q9: Where do you see PlanetWatchers 3 years from now? What do you think is going to be your biggest challenge in the year(s) to come – raising capital, growing your team, finding more clients?
We see a significant growth in geospatial enabled systems and envision PlanetWatchers’ platform integrated within the workflows of enterprises that manage large-scale distributed assets. We still need more frequent revisit times for imaging sources with higher resolution on both radar and optical sources in order to fulfill our vision, but as more satellites go up, revisit times go down.
Q10: You are based in Tel Aviv, Israel, how’s the startup scene? Are there many investors specifically looking at geospatial companies? Are there any local meetups/events that cater to the geo community?
One of the biggest advantages to have your startup HQ in Tel Aviv, especially in the geospatial space, is that the universities in Israel educate very strong talent that is significantly scarce in other geographies. Roi did his thesis at a NASA-affiliated lab and Amihai, the head of our remote sensing team, completed his thesis in hyperspectral sensing at another lab. The military units are also a great source of talent for our space and here everyone after their service wants to be in a startup. Yes, you can see an increasing interest from investors to source and invest in geospatial companies and the geo community is flourishing as a result.
Q11: Okay, this is a tricky one – on a scale of 1 to 10 (10 being the highest), how geoawesome do you feel today?
We feel that it’s an awesome time to be in the geospatial space so definitely more than 10.
Q12: Any closing remarks for anyone looking to start their own geo startup?
The PlanetWatchers team is extremely passionate about the field and always excited to speak with entrepreneurs who are looking to start their geo startup and share our experience, insights and provide support from our domain expertise. Feel free to reach out to us at info@planetwatchers.com.
The Next Geo is supported by Geovation:
 Location is everywhere, and our mission is to expand its use in the UK’s innovation community. So we’re here to help you along your journey to success. Get on board and let’s start with your idea…
Learn more about Geovation and how they can help turn your idea into reality at geovation.uk
About The Next Geo
The Next Geo is all about discovering the people and companies that are changing the geospatial industry – unearthing their stories, discovering their products, understanding their business models and celebrating their success! You can read more about the series and the vision behind it here.
We know it takes a village, and so we are thrilled to have your feedback, suggestions, and any leads you think should be featured on The Next Geo! Share with us, and we’ll share it with the world! You can reach us at muthu@geoawesomeness.com or via social media 🙂