

Cesium – a startup dedicated to making 3D geospatial data accessible, shareable, and ultimately usable – has just added a new global base layer that promises to make urban mapping applications built using the Cesium visualization platform much more engaging.
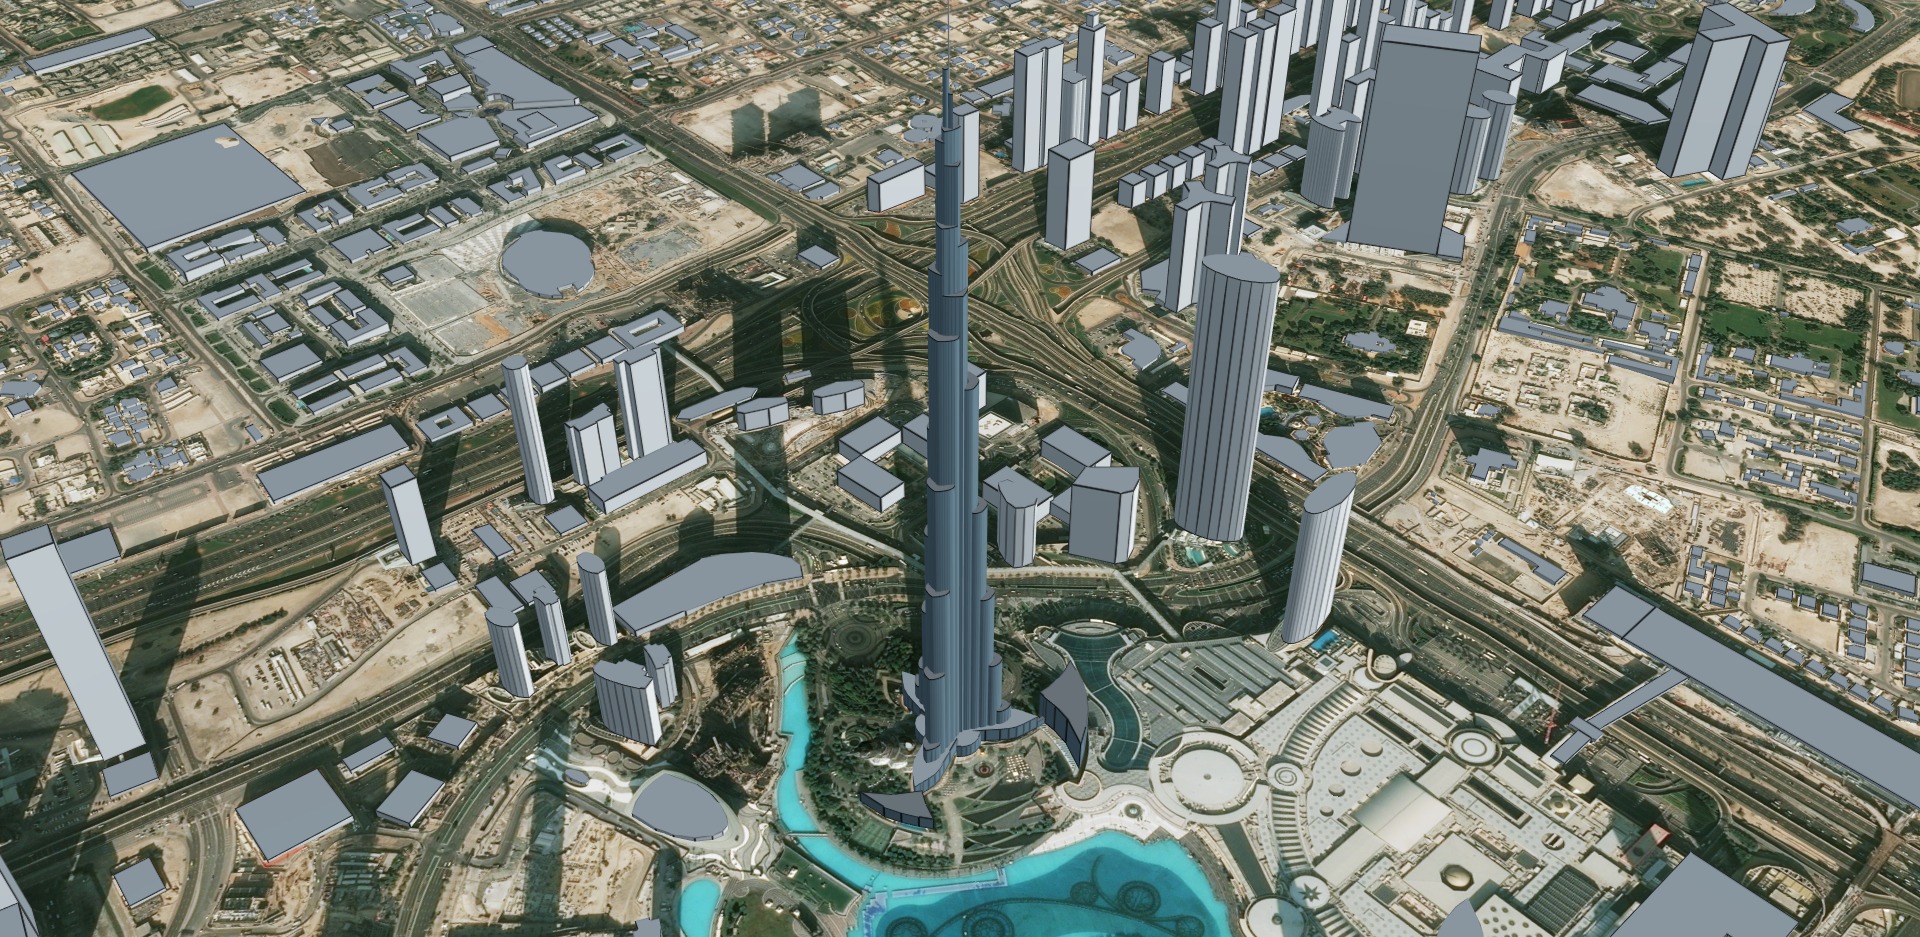
Cesium OSM Buildings is a 3D buildings layer covering the entire world built with OpenStreetMap building data. That means more than 350 million buildings with incredibly rich metadata – think building names, building type, address, opening hours, building height, and even the shape of the roof in some cases!
Available as a 3D Tileset on Cesium ion, OSM Buildings could prove to be a great base to layer high-resolution data on and provide immersive urban experiences. Since the data is crowdsourced and updated monthly, cities, governments, or even builders should be able to create numerous shareable 3D solutions using Cesium OSM Buildings.
Also see: Cesium builds 3D data visualization app for construction giant Komatsu
For example, the base layer could be used for urban planning, tax assessment, or traffic management. BIM models of construction projects could be visualized with a real-world context. Government agencies could use it as an innovative tool for training and simulation. And with per-building metadata, you could even highlight all commercial and residential buildings to see patterns in different neighborhoods across a city.
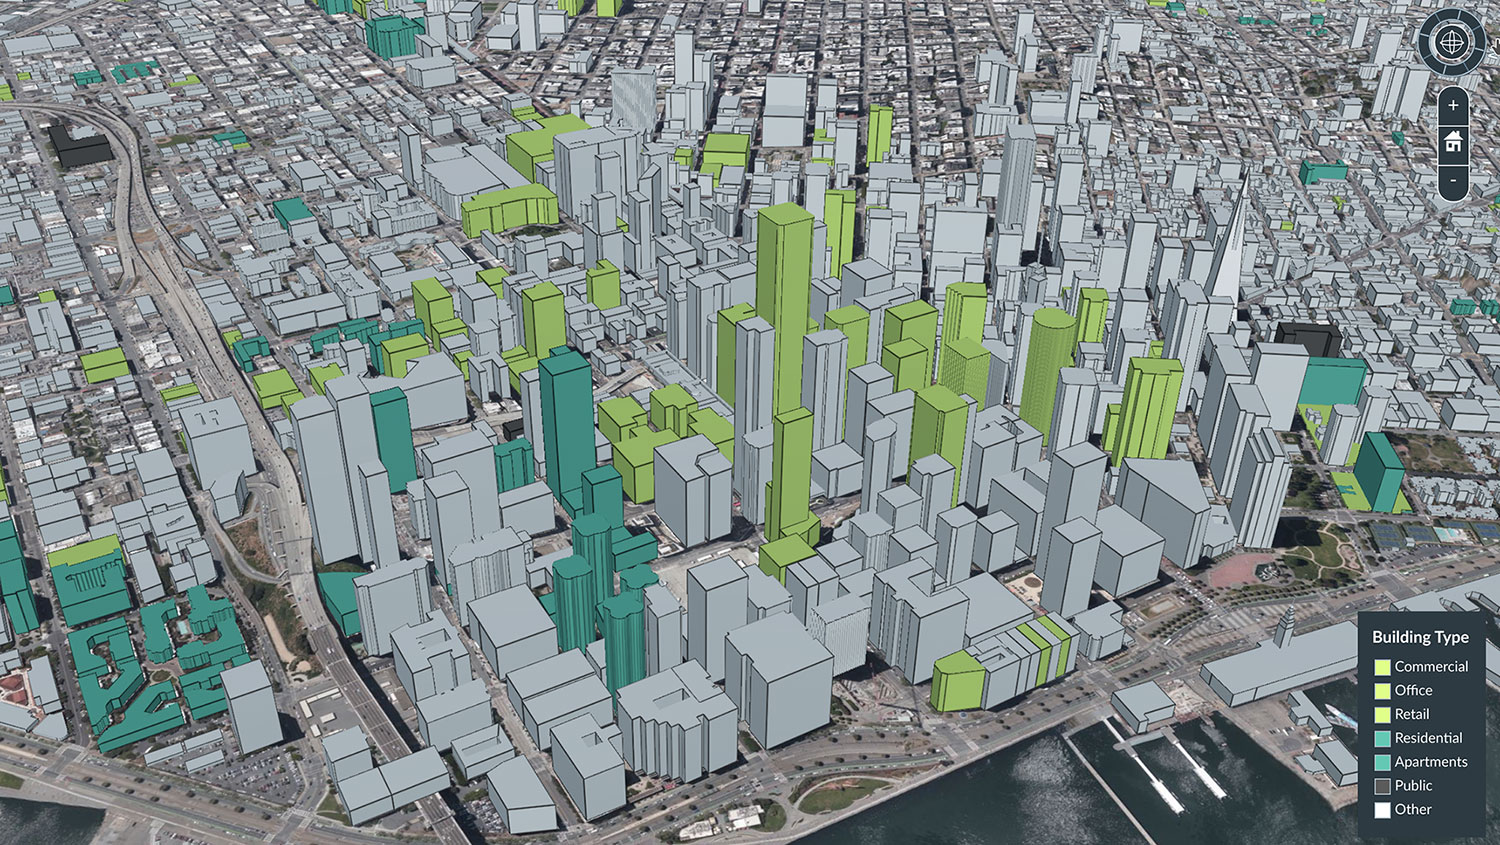
Highlighting all offices and commercial buildings in green using Cesium Stories
The full dataset is hundreds of gigabytes in size. But when you use it with Cesium 3D Tiles, the data can be streamed efficiently and visualized over the web. 3D Tiles is an open standard, so Cesium OSM Buildings can be used in any compatible viewer, in addition to the open-source CesiumJS.
Try out the data here.

#Business


Next article

AI, satellite data to predict blazes ahead of US wildfire season
With COVID-19 threatening to make the already stressful wildfire season worse across the western United States, scientists are turning to satellite imagery and artificial intelligence for better blaze predictions.
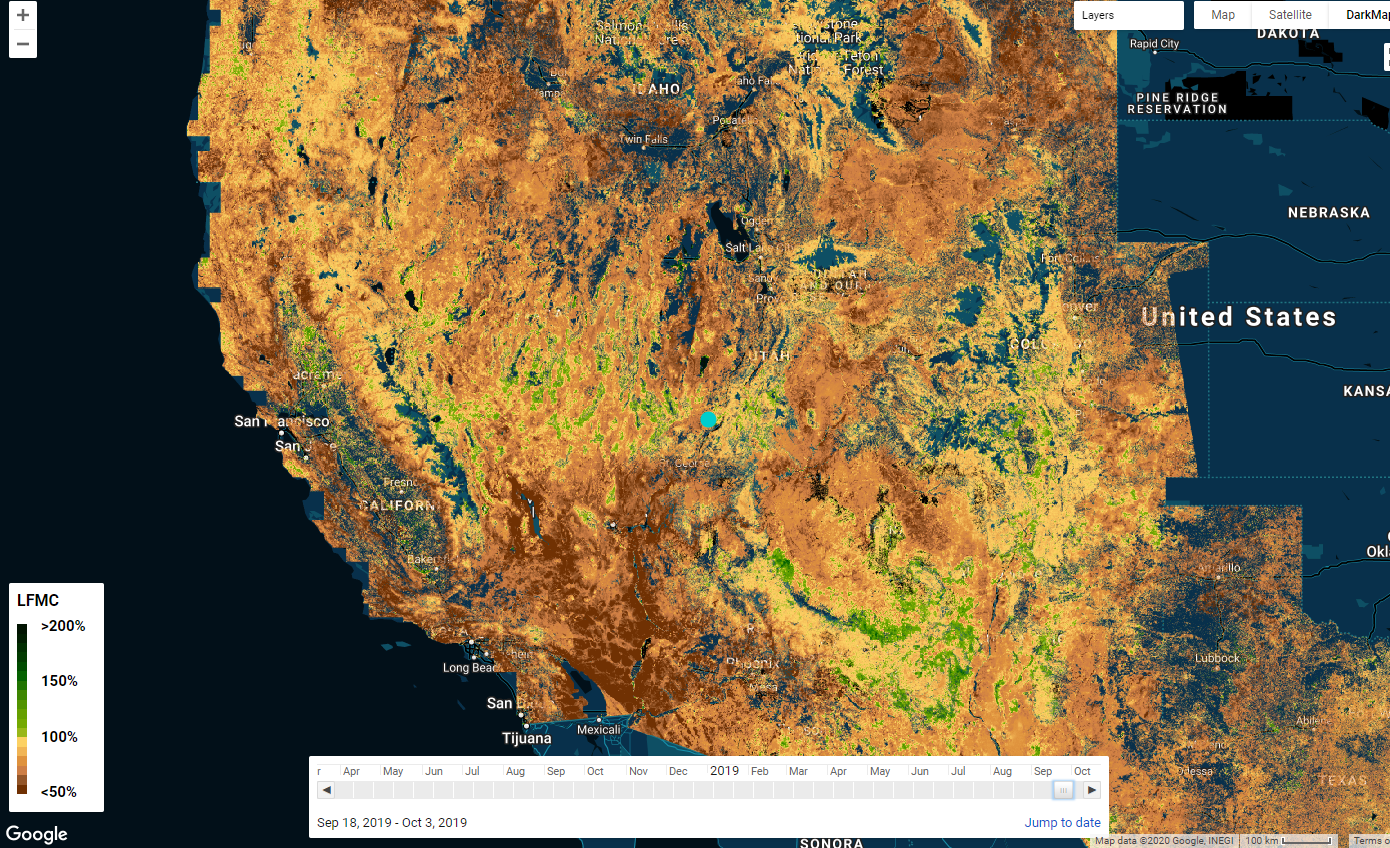
The model’s estimates feed into an interactive map that fire agencies may eventually be able to use to identify patterns and prioritize control measures. Screengrab by Ishveena Singh
Researchers at Stanford University have developed a deep-learning model that can analyze remotely-sensed data to identify and reveal areas that are at the greatest risk of wildfires.
The likelihood that a wildfire would occur in a particular region depends on several factors: the availability of ignition sources, the propensity of vegetation to ignite, and the ease of fire spread once the fuel has ignited. Live fuel moisture content (LFMC), which is defined as the mass of vegetation water per unit dry biomass, is a key underlying factor in all the three components. Higher the LFMC, wetter the vegetation, and lesser the risk of wildfire. And vice-versa.
Typically, to determine the amount of flammable vegetation in an area, fire agencies chop and weigh samples from a small number of trees, dry them out in an oven, and then weigh them again – to see how much water weight the vegetation has lost.
“That’s obviously really laborious, and you can only do that in a couple of different places, for only some of the species in a landscape,” Stanford ecohydrologist Alexandra Konings, points out.
Indeed, the US Forest Service has painstakingly done this job since the 1970s at hundreds of sites across the country and amassed around 200,000 water content measurements for the National Fuel Moisture Database.
Meanwhile, the artificial intelligence system proposed by Stanford researchers estimates fuel moisture from two types of satellite data:
- Measurements of visible light bouncing off Earth
- Synthetic aperture radar (SAR), or measurements of the return of microwave radar signals, which can penetrate through leafy branches to the ground surface
“One of our big breakthroughs was to look at a newer set of satellites that are using much longer wavelengths, which allows the observations to be sensitive to water much deeper into the forest canopy and be directly representative of the fuel moisture content,” Konings tells, explaining how the machine learning model was fed on three years of data for 239 sites across the US west starting in 2015, when SAR data from the European Space Agency’s Sentinel-1 satellites became available.
Maps display the amount of water in plants relative to dry biomass across the American WestMaps display the amount of water in plants relative to dry biomass across the American West. Courtesy: Krishna Rao
Admittedly, the model needs more testing to figure into fire management decisions that put lives and homes on the line, but the AI predictions for shrublands are showing promise by matching most closely with the field measurements in the National Fuel Moisture Database.
Shrublands, which occupy as much as 45 percent of the American West, is not only the region’s biggest ecosystem, but it is also extremely susceptible to frequent fires since it grows back rapidly.
According to Krishna Rao, a Ph.D. student in Earth system science at Stanford, the model is already illuminating previously invisible patterns. “Just being able to see forest dryness unfold pixel by pixel over time, can help reveal areas at greatest risk and chart out candidate locations for prescribed burns.”