


Last week Apple made an announcement that it has invested $1 billion in China’s most popular ride hailing app Didi Chuxing. According to Reuters, it has 87% of the Chinese ride sharing market, leaving Uber far behind.
Founded in 2012 in Beijing, Didi Chunxing is one of the most valuable start-ups in China worth roughly $25 billion (compared to ~$51bn valuation of Uber that operates globally) The company claims to complete more than 11 million rides a day and have over 14 million drivers on its platform.
Apple has been looking into China for long time now as it is becoming Apple’s biggest iPhone market. When the company launched the transit feature to its Maps last year it supported only a few cities in the US and Europe and over 300 cities in China.
“We are making the investment for a number of strategic reasons, including a chance to learn more about certain segments of the China market,” Apple CEO Tim Cook told Reuters. “Of course, we believe it will deliver a strong return for our invested capital over time as well.”

#Business


Next article
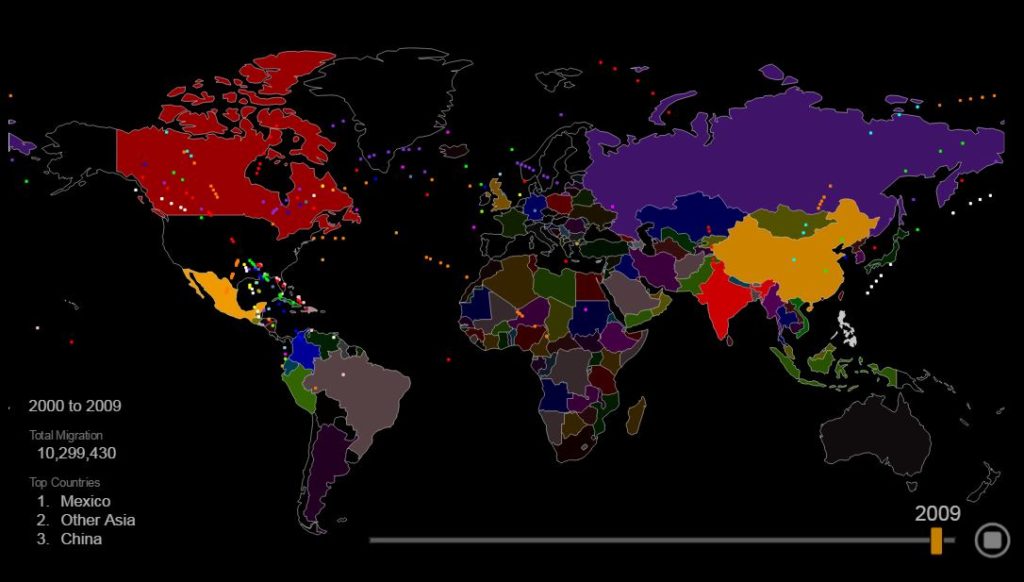

With the presidential elections in the US and Middle East crisis in Europe and Africa, immigration remains a hot topic. Max Galka who recently visualized 10 years of fatal traffic accidents decided to take a look at data from the US Office of Immigration Statistics and he created a new visualization.
His latest map shows two centuries of immigration to the U.S. reminding everyone that ‘the US is a nation of immigrants’. The visualisation shows the history of emigration of 79 million people who obtained lawful permanent resident status in the US between 1820 and 2013. The map visualizes all of them based on their prior country of residence.
Through time, the immigration sources trace a clear path through the world. Starting in Western Europe with Ireland, Germany, and the U.K., the source moves east to Italy, Russia, and Hungary before shifting to the Americas and finally to Asia.
The brightness of a country corresponds to its total migration to the U.S. at the given time, shown by the timeline at the bottom of the map. One dot represents 10,000 people. We’ve asked Max about technology he used to generate the map:
The background map and the text are SVG elements, which I coded using D3. The particles were implemented separately by overlaying a Canvas element on top. Beyond that, the rest of the work involved preparing the data, most of which I did in Excel and QGIS.
Cool project!