
Your Android phone could beef up world’s largest earthquake detection network

Millions of people around the world live in earthquake-prone regions. And while earthquakes cannot be predicted, a few seconds of warning can make all the difference in giving people time to drop, cover, and hold on before the shaking arrives. Japan, Mexico, and California have built a costly network of hundreds of land-based seismometers to generate such early warnings.

But did you know the tiny accelerometers in your Android phone – aka the sensors that measure direction and force of motion to determine if you’re holding your phone in landscape or portrait mode – could also detect potential earthquake signals? And Google has found a way to harness the power of the mini seismometer that is your Android phone!
Working with globally-renowned seismology and disaster experts, the technology giant has come up with a crowdsourced approach for detecting earthquakes all around the world – the Android Earthquake Alerts System.
If a participating phone detects vibrations that are typically linked to seismic activity, it would send out a signal to Google’s earthquake detection server, along with a coarse location of where the shaking occurred. The server will then combine information from hundreds of other Android phones to figure out if an earthquake is happening.
Also see: How Google is using submarine cables as earthquake, tsunami warning systems
“We’re essentially racing the speed of light (which is roughly the speed at which signals from a phone travel) against the speed of an earthquake. And lucky for us, the speed of light is much faster!” says Marc Stogaitis, Principal Software Engineer, Android.

To begin with, this technology will be leveraged to share a fast, accurate view of the impacted area on Google Search. So, when you look up “earthquake” or “earthquake near me,” you’ll find relevant results for your area, along with helpful resources on what to do after an earthquake.
Google has been bridging the information gap during crises for over a decade now. Ever since the devastating Carmel Mountain fire started blazing outside its offices in Israel in 2010 and Google employees experience a potentially life-impacting information gap first-hand, the company has made it its mission to connect people with high-quality information during crises.
In the last 10 years, Google has initiated Public and SOS alerts for hundreds of thousands of crises around the world – right from wildfire mapping and flood forecasting to earthquake detection and alerts.
Now read: Google uses satellite data to add wildfire location-tracking to Maps, Search

#Business


Next article
The First Fleet of 1,485 settlers first arrived in New South Wales on January 26, 1788 – a date which is now celebrated annually as Australia Day. Since then, Sydney has developed into one of the world’s largest, most cosmopolitan cities, with a population of over 5 million and a unique mix of Aboriginal, British, Asian, and European cultural influences.
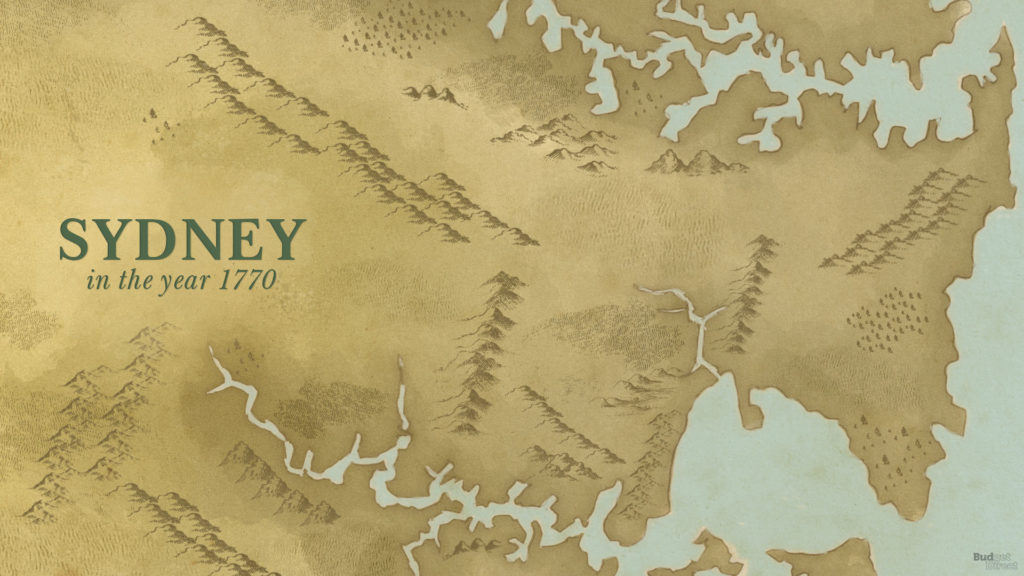
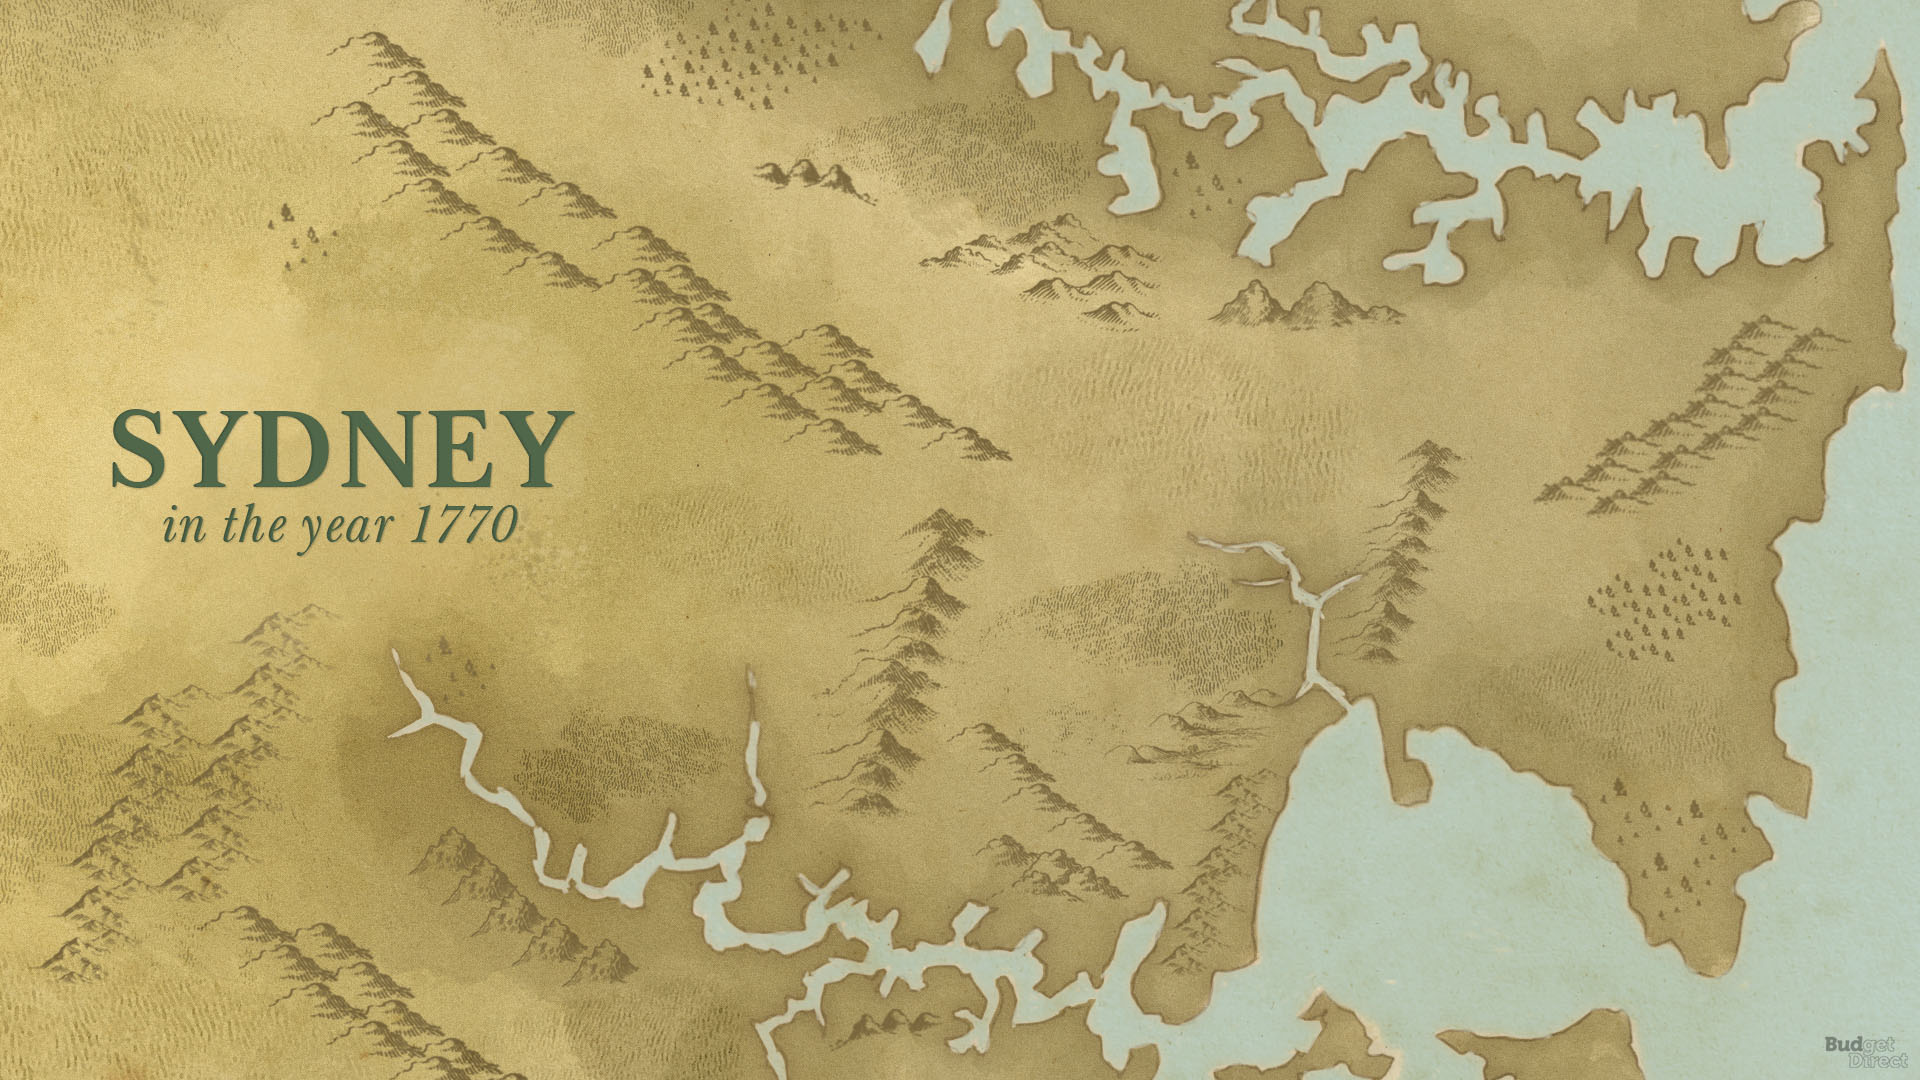
To get a better understanding of how Sydney became the modern metropolis it is today, Budget Direct analyzed dozens of maps of Sydney from the National Library of Australia and other sources from the years 1770-2020. They then designed their own maps combining information and features from the historical maps to create the below animation that depicts the major infrastructural, architectural, and demographic developments of the city:
Some important historical maps whose modernized avatar can be seen in the above video include:
A Plan of Sting-Ray Bay – 1770
Drawn by Richard Pickersgill, as part of the HM Bark Endeavour expedition led by Lieutenant James Cook, this map got its name due to the presence of stingrays, until the discovery of new plants in the region prompted Cook to call it Botany Bay.
Sydney Cove Port Jackson Map – 1788

This was the first known etching of the first settlement in Sydney – a penal colony at Sydney Cove. The full title of the map is “Sketch & description of the settlement at Sydney Cove Port Jackson in the County of Cumberland taken by a transported convict on the 16th of April, 1788, which was not quite 3 months after Commodore Phillips’s landing there.”
Commodore Arthur Phillip was a British Royal Navy officer who became the first Governor of New South Wales, and established its earliest penal colony.
A topographical plan of the settlements of New South Wales – 1799
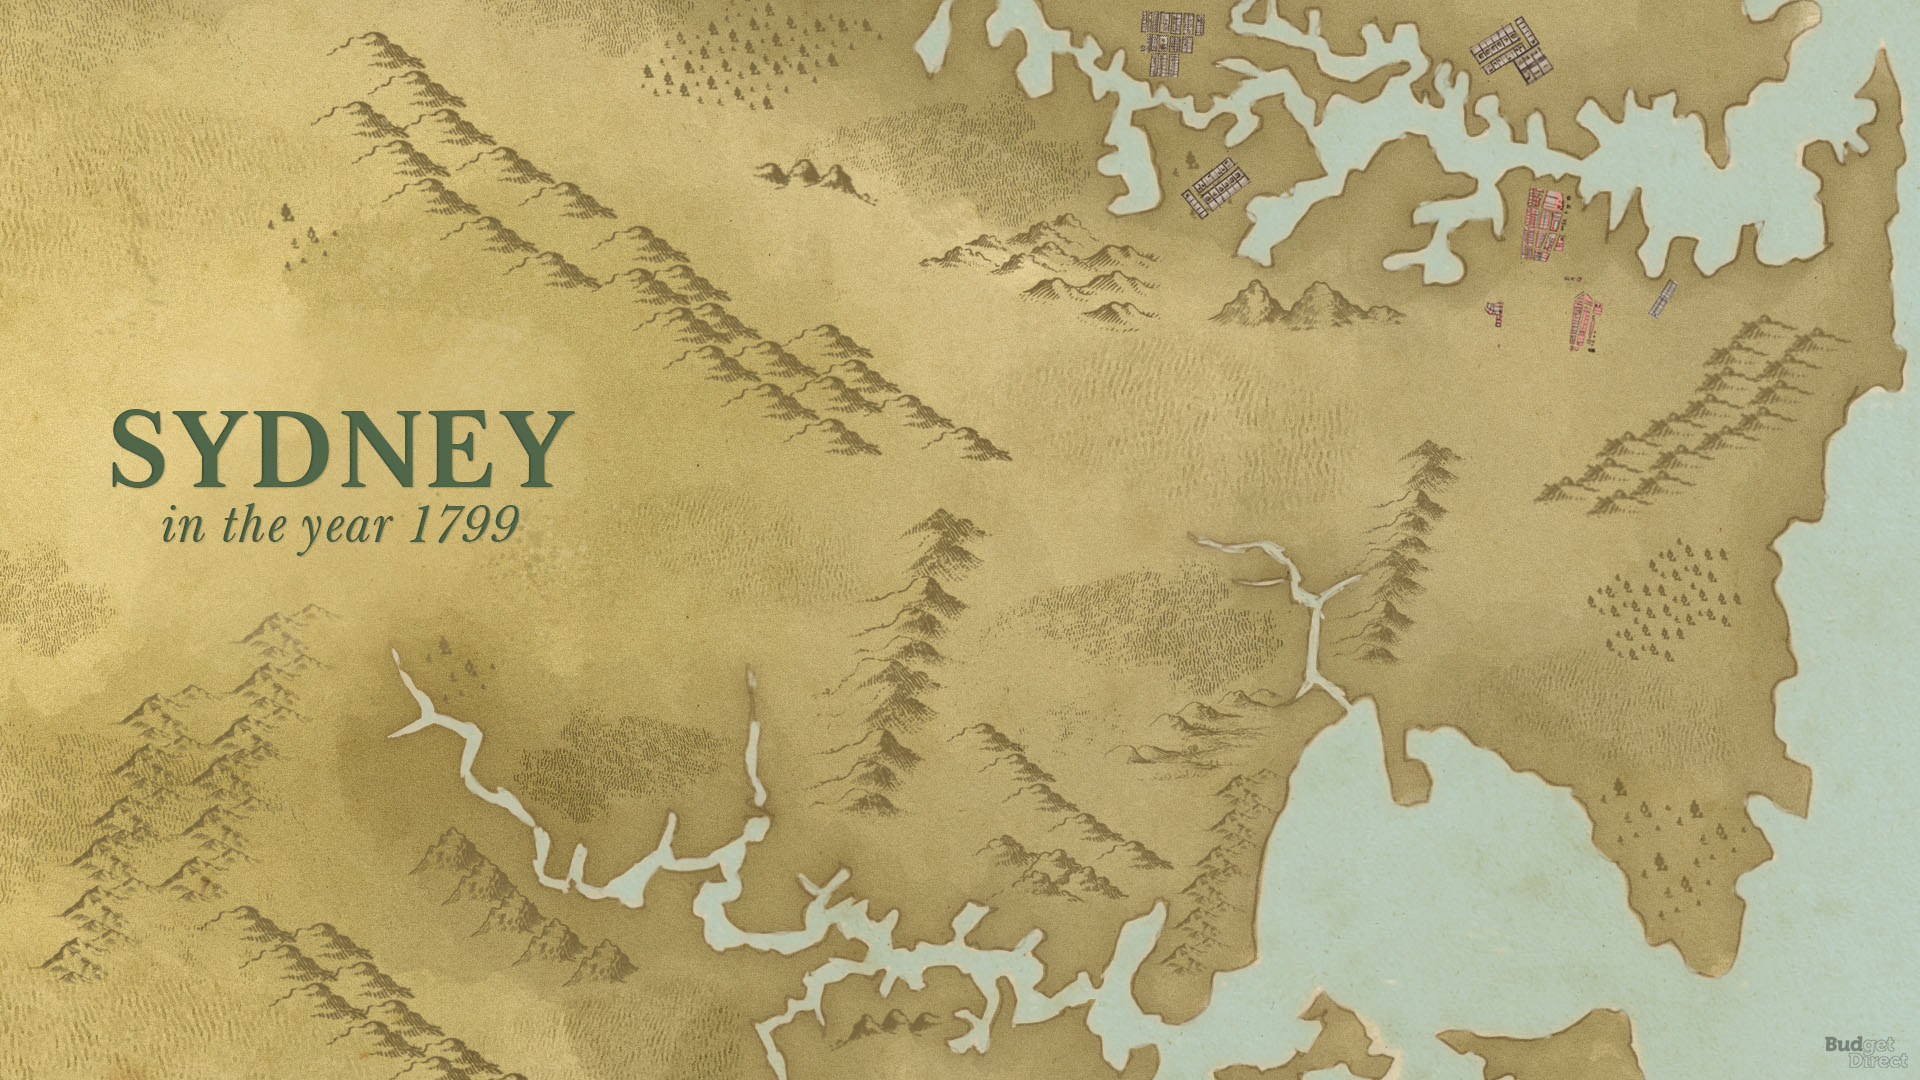
This map was made to show the progress of exploration since 1788, completed by professional cartographers and explorers Charles Grimes and Matthew Flinders. Additions to the map were made in 1815.
Plan de la ville de Sydney – 1802

This map was drawn during the Voyage de découvertes aux terres Australes, a scientific expedition commissioned by the Institut de France whose purpose was to observe the geography and natural history of New Holland. The expedition was approved by Napoléon Bonaparte, as First Consul, and Nicholas Baudin was chosen as commander. In April 1802, Baudin’s ship the Geographe had an encounter with the Investigator, a British ship captained by Matthew Flinders, who was also on an expedition to chart New South Wales.
Plan of the town and suburbs of Sydney, August, 1822 – 1822
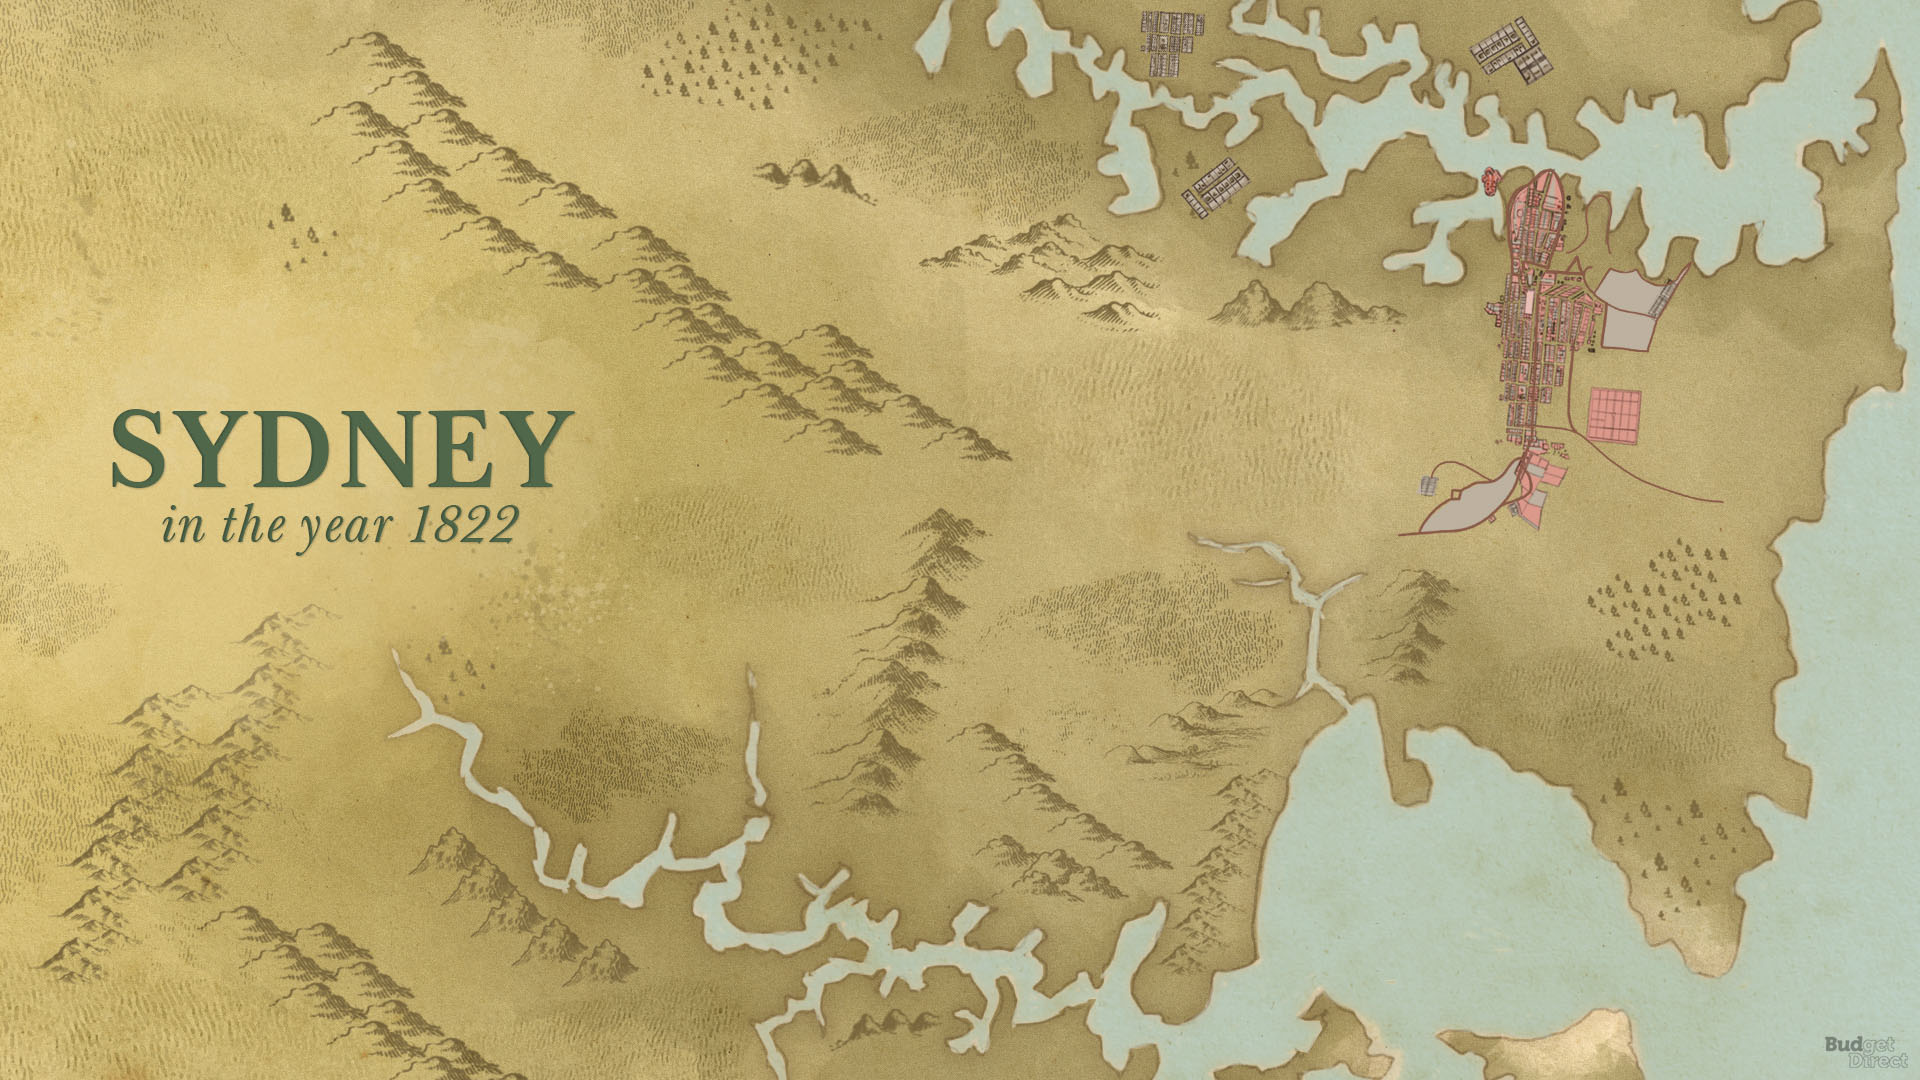
This map has an unknown author and place of publication. It was likely commissioned by then Governor Thomas Brisbane. It is currently held in the National Library of Australia.
Map of Sydney showing in contrast the town of 1802 with the city of 1873 – 1873
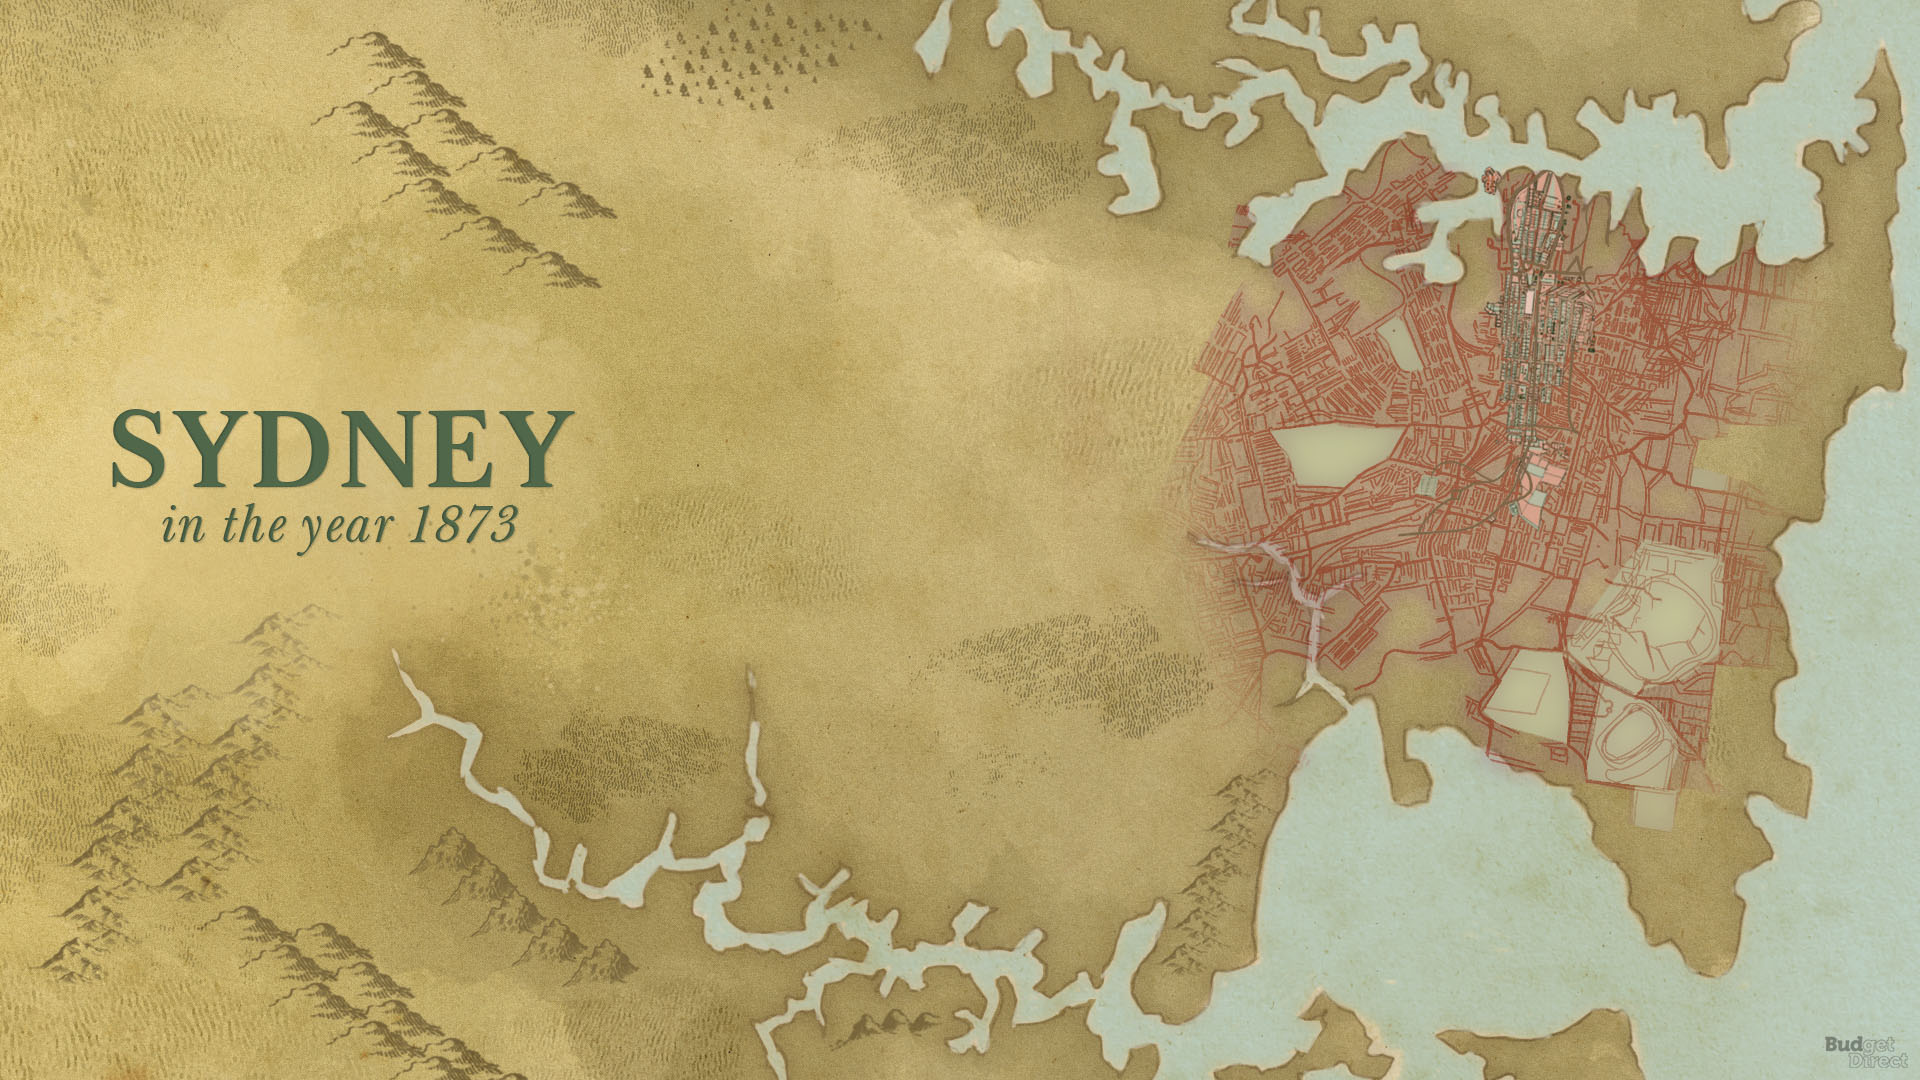
This map was published as a supplement to Sydney Mail magazine to show the growth and development of Sydney from 1802 to 1873. The 1802 base layer used in the map is believed to be from an engraving published in Francois Peron’s 1775-1810 Voyage de decouvertes aux terres australes. This map is currently in the National Library of Australia.
Sydney and suburbs tramway lines – 1894
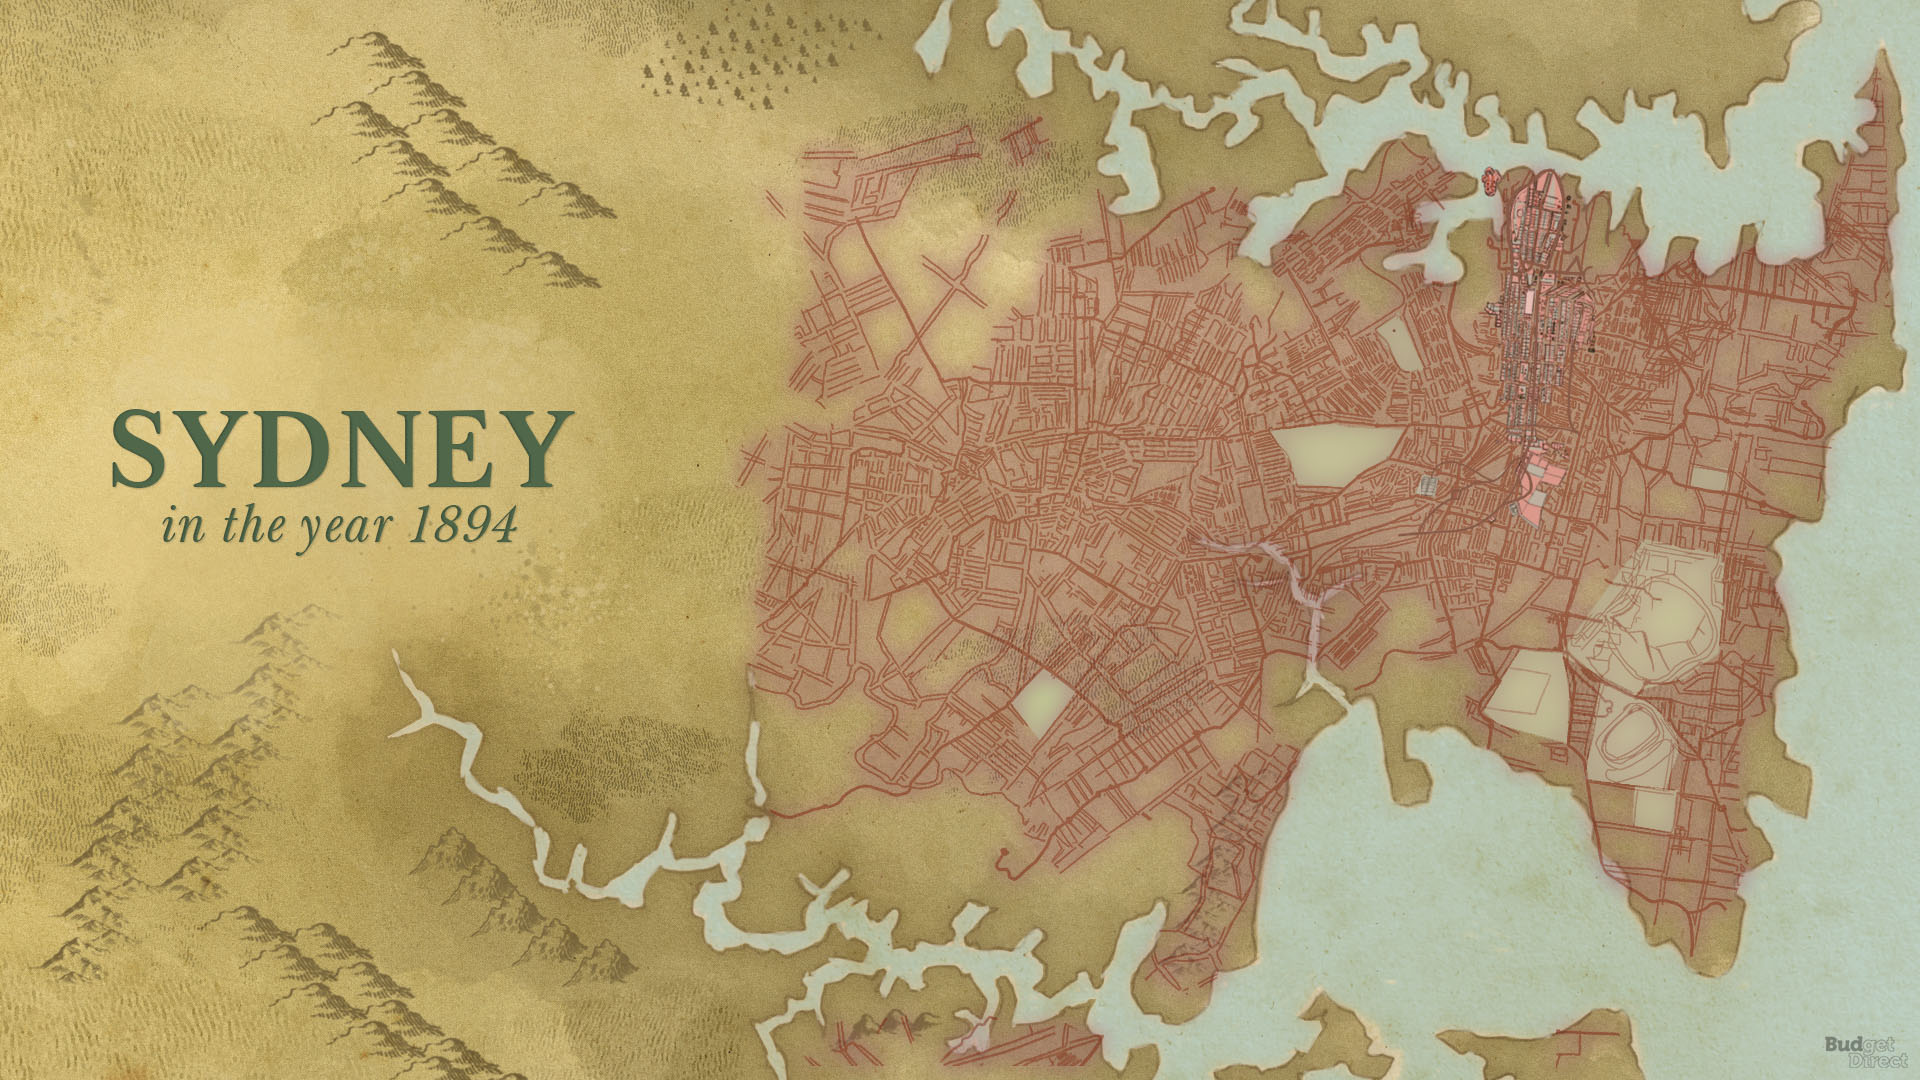
This is a rail map for Sydney’s new and extensive tram system, which at one point was the most extensive tram system of any city in the British Empire other than London. It is currently held in the National Library of Australia.
Gregory’s Sydney Street Directory: 1934 – 1934
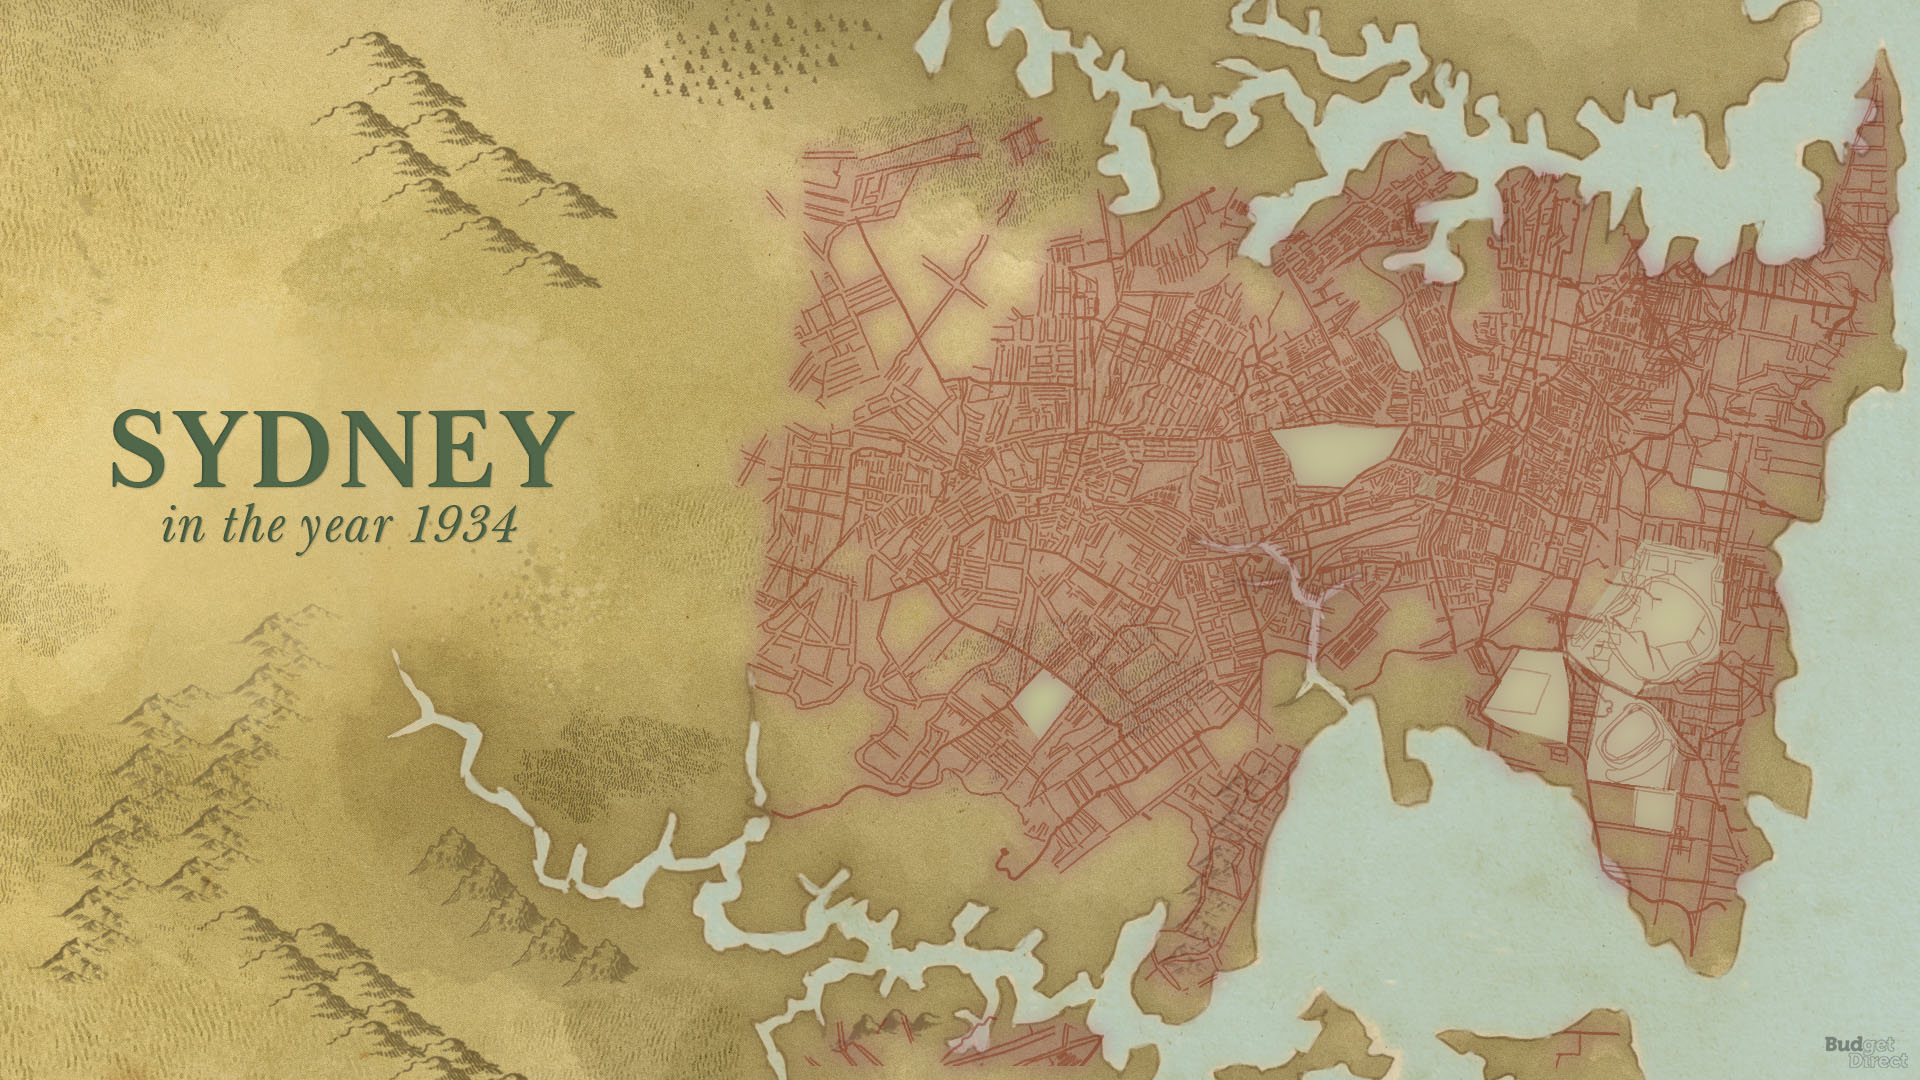
This is the first edition of Gregory’s Street Directory, which produced street maps of Sydney throughout the 20th century. Today Universal Publishers publishes UBD-Gregory’s street directories of Australia.
‘Sydney Into Its Third Century’ map – 1988
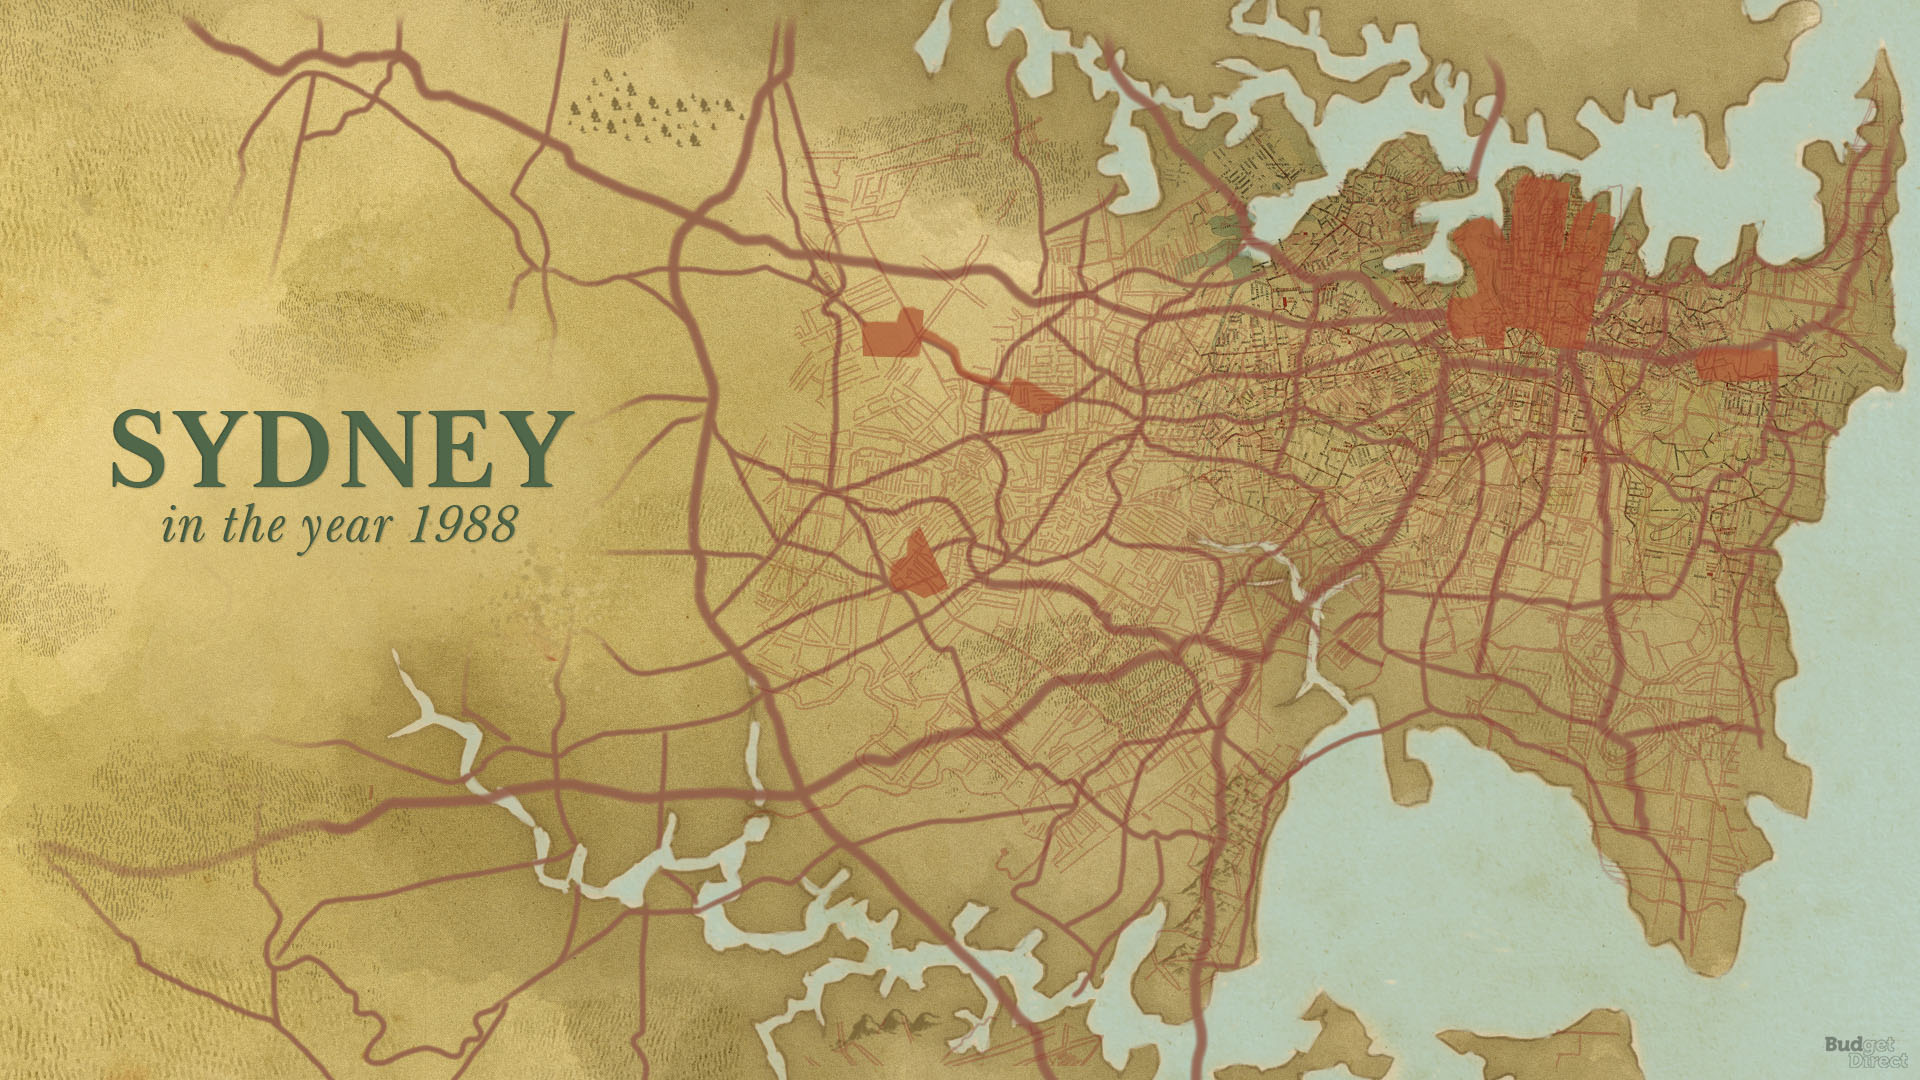
This map was commissioned during the 200th anniversary of the city of Sydney, and was meant to replace the 1968 Sydney Region Outline Plan. It was a departure from earlier planning visions, as it prioritized urban density, as opposed to the use of green belts of earlier regional plans. It currently belongs to the Government of New South Wales.
Olympic Competition Day 2, Sunday 17 September 2000 – 2000
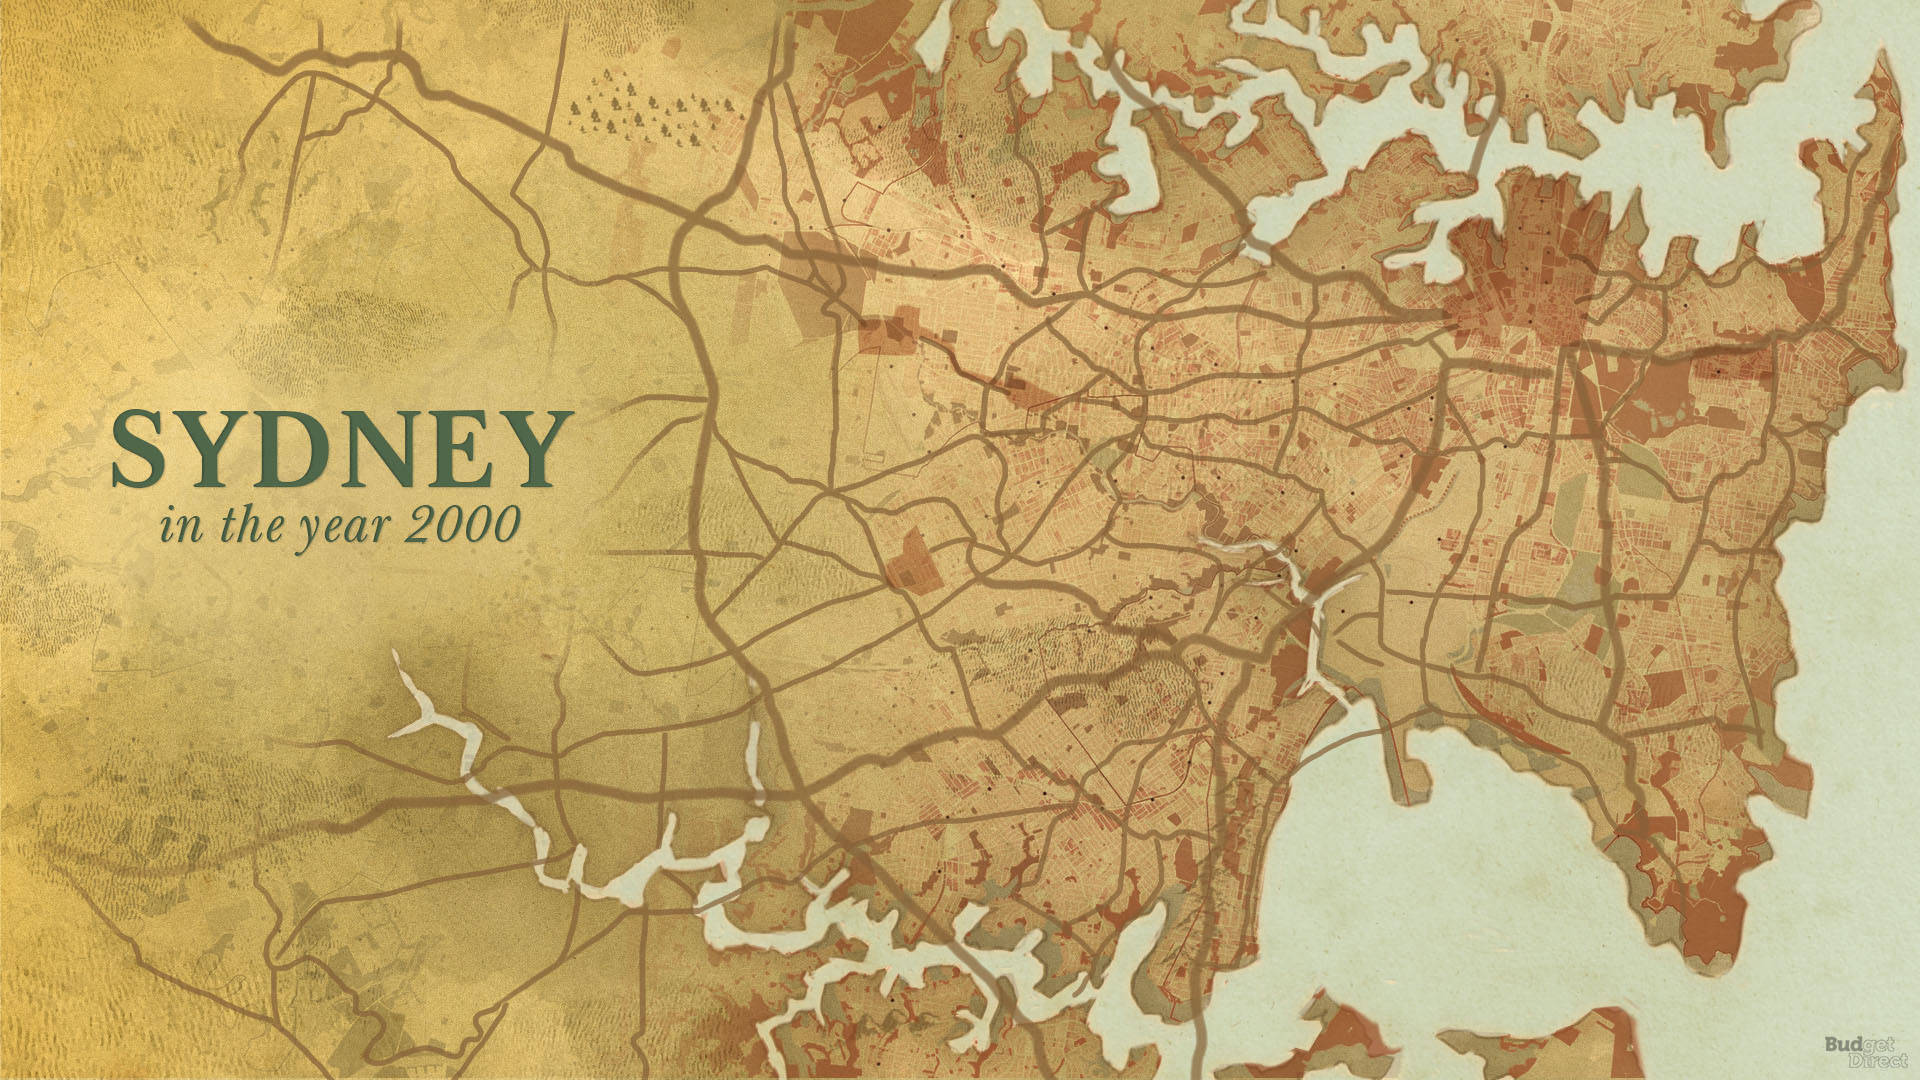
This map was created by the Transport Management Centre for internal use during the 2000 Olympic Games to help with traffic management. It is one of 16 Olympic day maps produced during the games. It is featured in the Esri Map Book Volume 16 under Transportation, titled “Olympic Mapping”.
‘Sydney Green Grid’ map – 2017
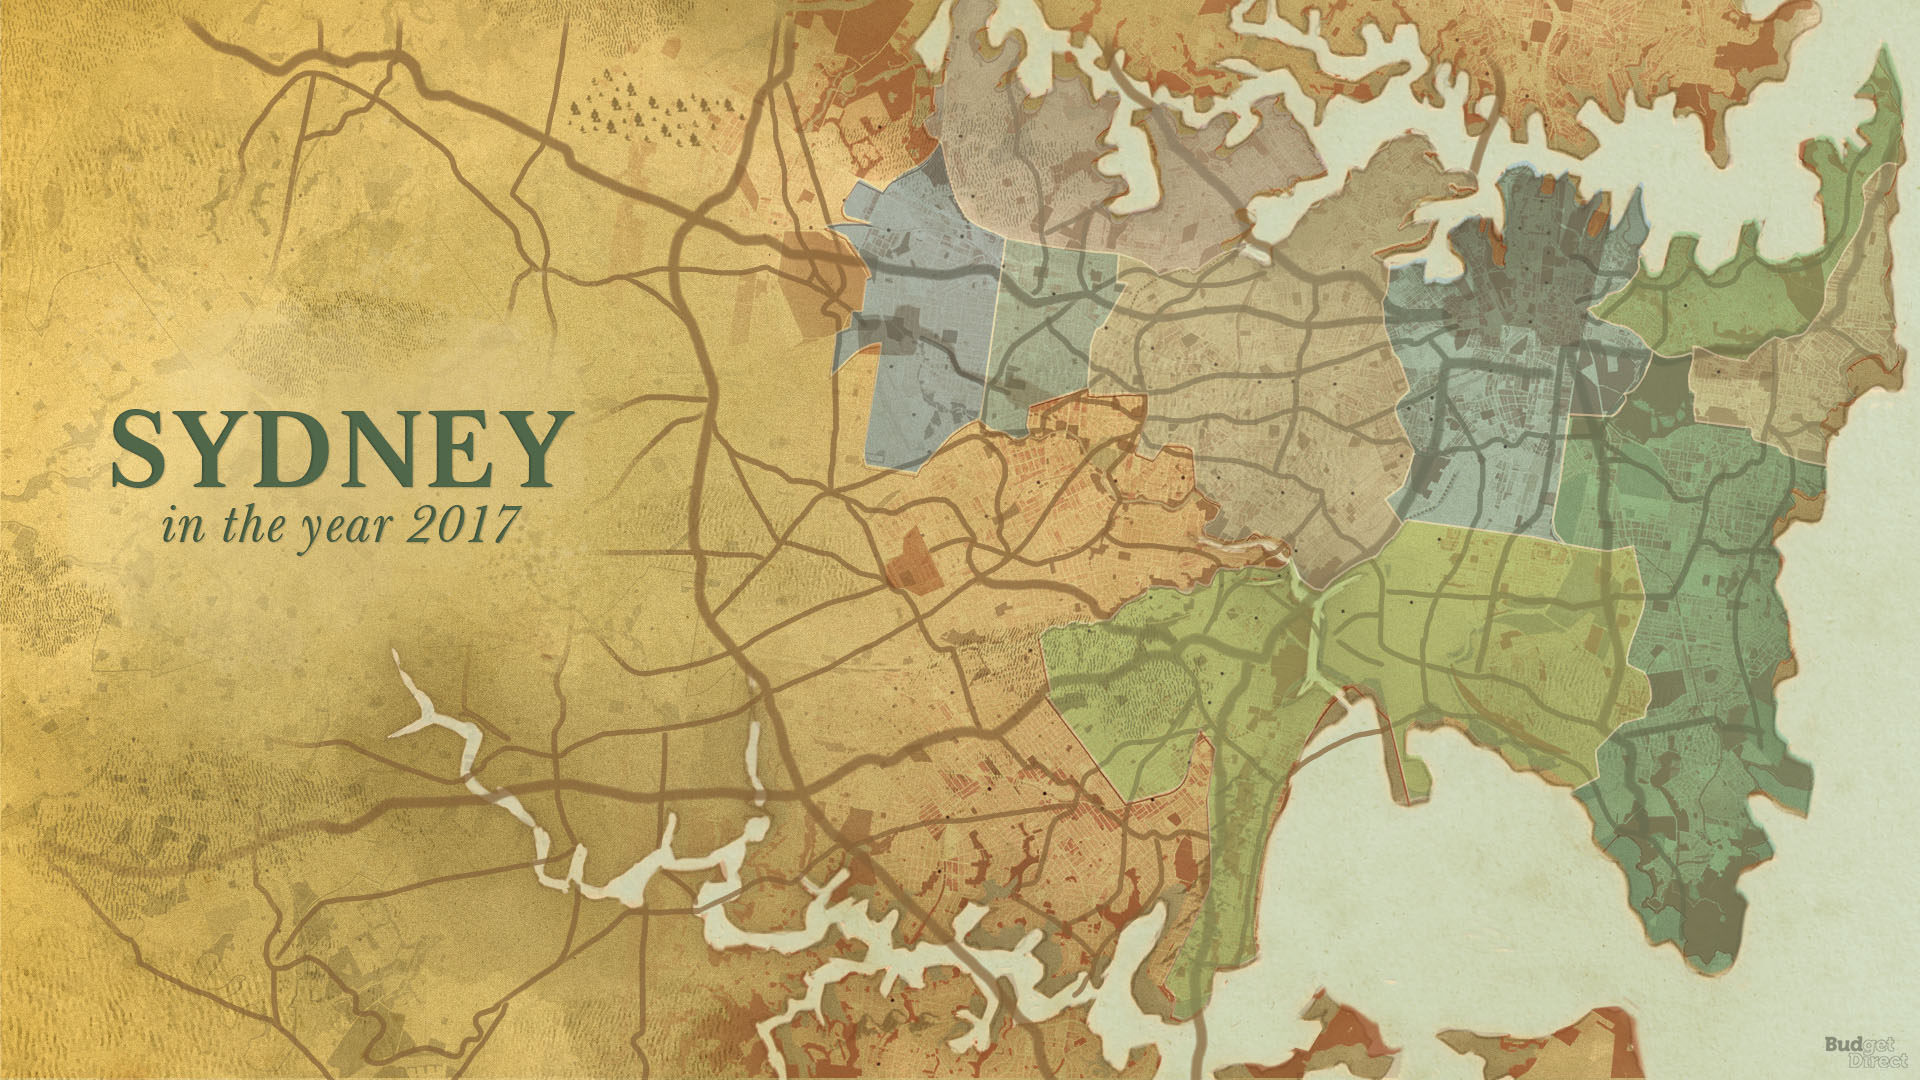
This map was made by Tyrell Studio in association with the Office of the New South Wales Government Architect, prepared for the Department of Planning and Environment. It was made to help aid in the creation of District Plans for Sydney and specifically focuses on the city’s open green spaces.