
Map projections can be considered quite a difficult concept especially for “mathematically-disabled” people. Maybe after conceptualizing the stuff like datum and reference systems, projections are a piece of cake, but still representing 3-dimensional geographic phenomena on the flat surface with the full control of all distortions in complicated enough to cause a serious headache.
This illustration from the book “Elements of map projection with applications to map and chart construction” written in 1921 by Charles H. Deetz (born in 1864) and Oscar S. Adams, (born in 1874) is one of the best illustrations of the concept of map projections ever.
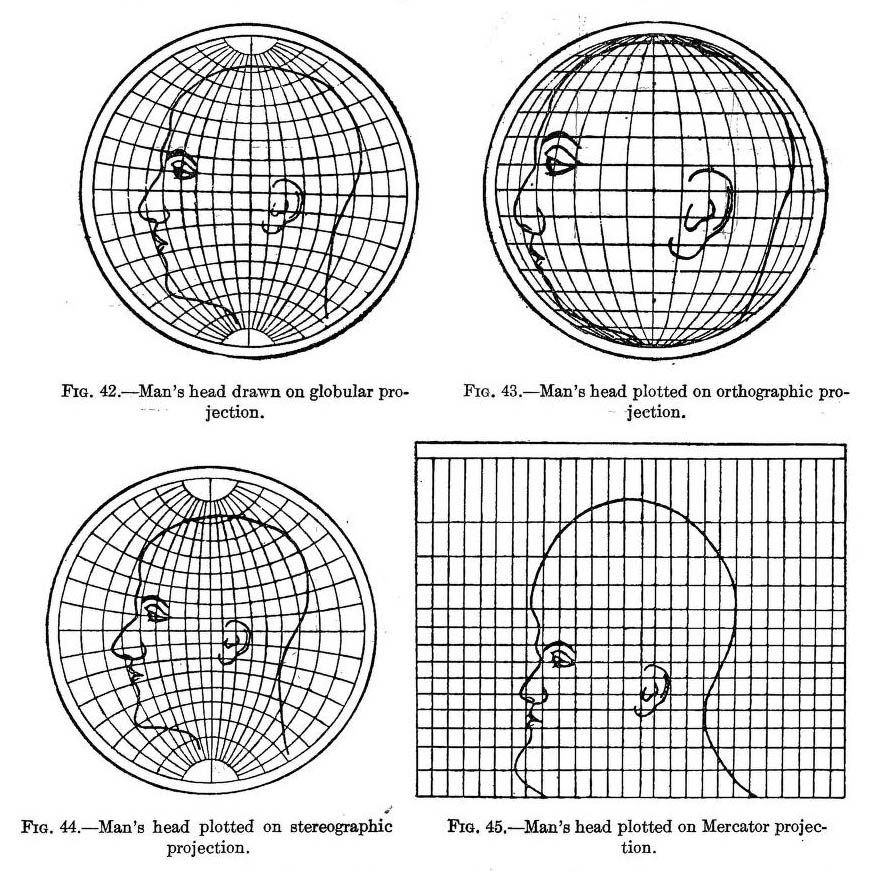
The left top figure shows a human head drawn on a globular projection of a hemisphere. The other three figures shows the distortions of the head in ortographic, stereographic and Mercator projections. Imagine that similar distortions happen to surface of the Earth presented on every map. Authors stress that this illustrations do not mean that the globular projection is the best of four, because symmetrical figure might be drawn on any one of them and then platted on the others with distortions. It shows however in a striking way the relative differences in distortions of different projections.
Amazing.
source: io9

#Ideas


Next article
The goal of cartographer is to create a spatio-temporal model of a certain phenomena and communicate it to the public in the most effective way. For years artists (at that time all cartographers were artists) used canvas and paper to show dynamic phenomena on a static media. Computers have changed it and allow to create amazing, interactive and very functional maps. But space in a not a flat surface and human senses, and therefore cartographical communication process, works most efficiently in multi-dimensional environment, namely real-life, tangible objects. This is why I always look with interest at projects which go beyond the digital or mobile user experience…

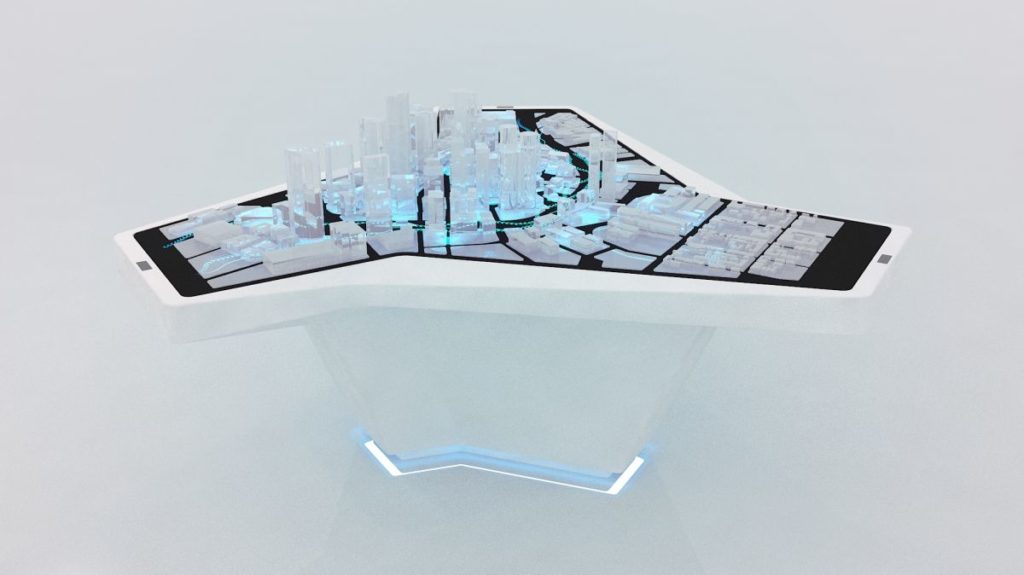
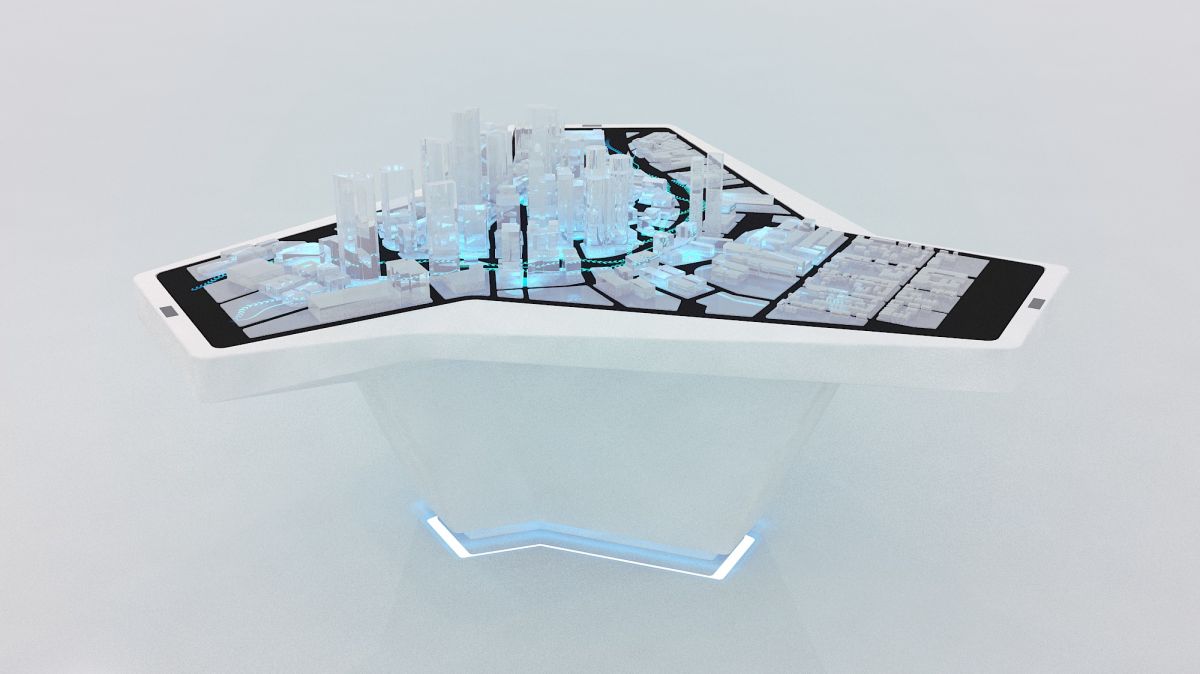
At the Consumer Electronics Show (CES) 2014 in Las Vegas, Audi promoted its Urban Future Initiative with this amazing interactive, augmented reality table to represent Boston’s urban mobility. The table has three arms made from acrylic grass covering flat screen monitors. Road traffic is shown in digital form on the glass surface. Visitors can interactively influence the city traffic by making swiping movements with their hands developed with Leap Motion controller. By gesture control visitors input data that optimise the flow of traffic into the system.
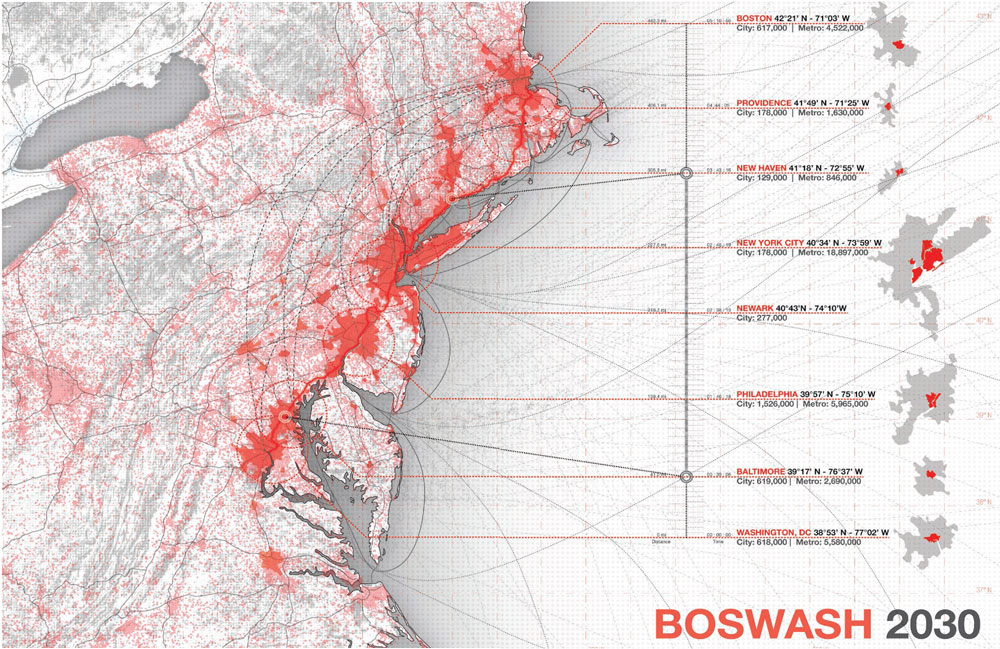
The data for the project come form the project called City Dossier Boston, which was developed by architects and urban planning company Höweler + Yoon, the winner of the Audi Urban Future Award 2012. Höweler + Yoon analyzed bottlenecks in the Boswash transportation network and derived visionary solutions. The task of presenting the output of the project has been given to the agency for communication design “Madhat” which did a pretty amazing job.
source: Audi