

As 2016 has just ended, it is a good time to reflect. The rapid evolution of the geospatial industry has continued this year. The technology is advancing at a breathtaking pace. Platforms and SaaS have become part of the vernacular. New terms have emerged like Web GIS. Rapid change is upon us.
2016: A Year of Geospatial Growing Pains
The geospatial industry has traditionally served the public and infrastructure sectors respectively. So local and state government, oil and gas, utilities etc. Organizations which manage assets: pipelines, water valves, roads, oil wells, parks etc. These assets have a location. The where questions, in relation to their management and upkeep, are obvious. These organizations have GIS departments; people trained to think spatially and use geospatial tools to answer where questions. In 2016 it became apparent that there is a growing awareness within the wider world, organizations new to geospatial, that there has been a focus on the Who, What, Why, and When but the Where has remained largely unanswered. These organizations are showing increasing interest in geospatial technology.
So, given this context, what high level (big picture) trends did we see in 2016?
Three in particular stand out:
1. Traditional users of GIS have been slow adopting, learning and applying Web GIS. Moving from desktop to cloud enabled and managed services, has proven a significant adjustment. ‘Lighting up the organization with GIS’ is in many cases yet to be fully realised. Discussions have continued as to the why’s, including some quite hard hitting articles: Assessing the Value of Today’s GIS Professional. Many have been looking for simple, initial points of entry for quick wins, such as building out ArcGIS Story Maps.
2. The fact that GIS is now far more affordable has opened the technology up to those who once could not afford the cost. Many of these organizations fall within traditional sectors (public and infrastructure): small cities, electric coops, smaller utilities etc. We have seen a growing number of inquiries from these types of organizations. Few have in-house geospatial expertise.
3. New, non-traditional sectors (banking, retail, insurance, manufacturing, advertising) are beginning to look in increasing numbers for answers to their where questions. Unlike traditional sectors, with the focus on the management of assets, the questions being asked are more varied and complex. From the categories defined in our GIS Solutions Pyramid these are tier 3 (or build and map) questions and above; impossible to answer without geospatial expertise, which many of these organizations lack.
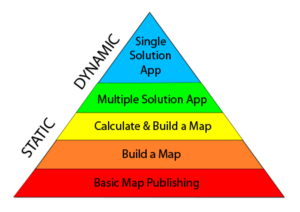
So how would we summarize 2016? A year of geospatial growing pains that’s how. Larger organizations (in both the traditional and non-traditional sectors), with experienced GIS staff have been the most successful in applying Web GIS. Those organizations with GIS staff new to Web GIS or without any in-house GIS expertise respectively have found moving beyond publishing maps (tiers 1 and 2 in our GIS Solutions Pyramid) challenging.
Lack of in-house geospatial expertise in a marketplace rapidly turning its attention to GIS for solutions is a key theme covered in the post about our 2017 geospatial industry predictions.
The article originally posted on WebMapSolutions blog.


#People


Next article

Trees make cities healthier and more livable. They help mitigate extreme temperatures, provide a natural respite from traffic, noise, and congestion, and improve the quality of life for those living in urban environments. They are a key part of any urban space but how to assess that your city is green enough?
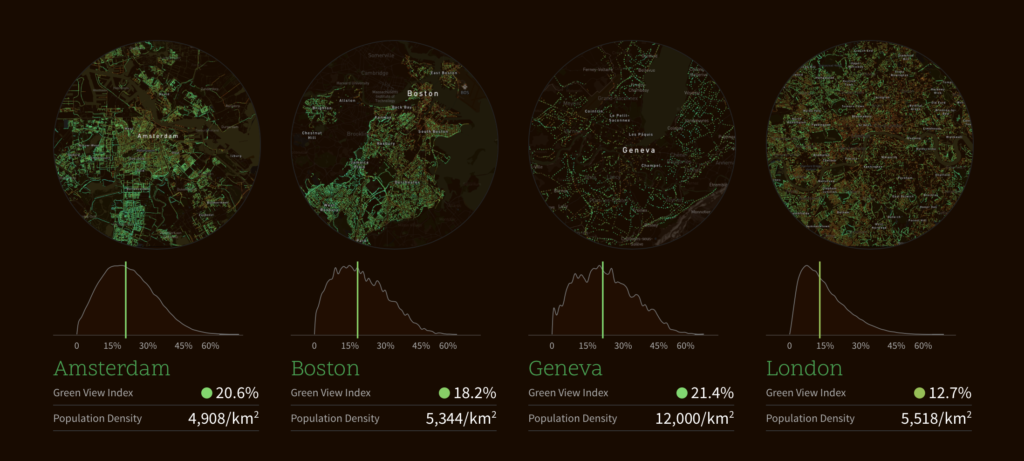
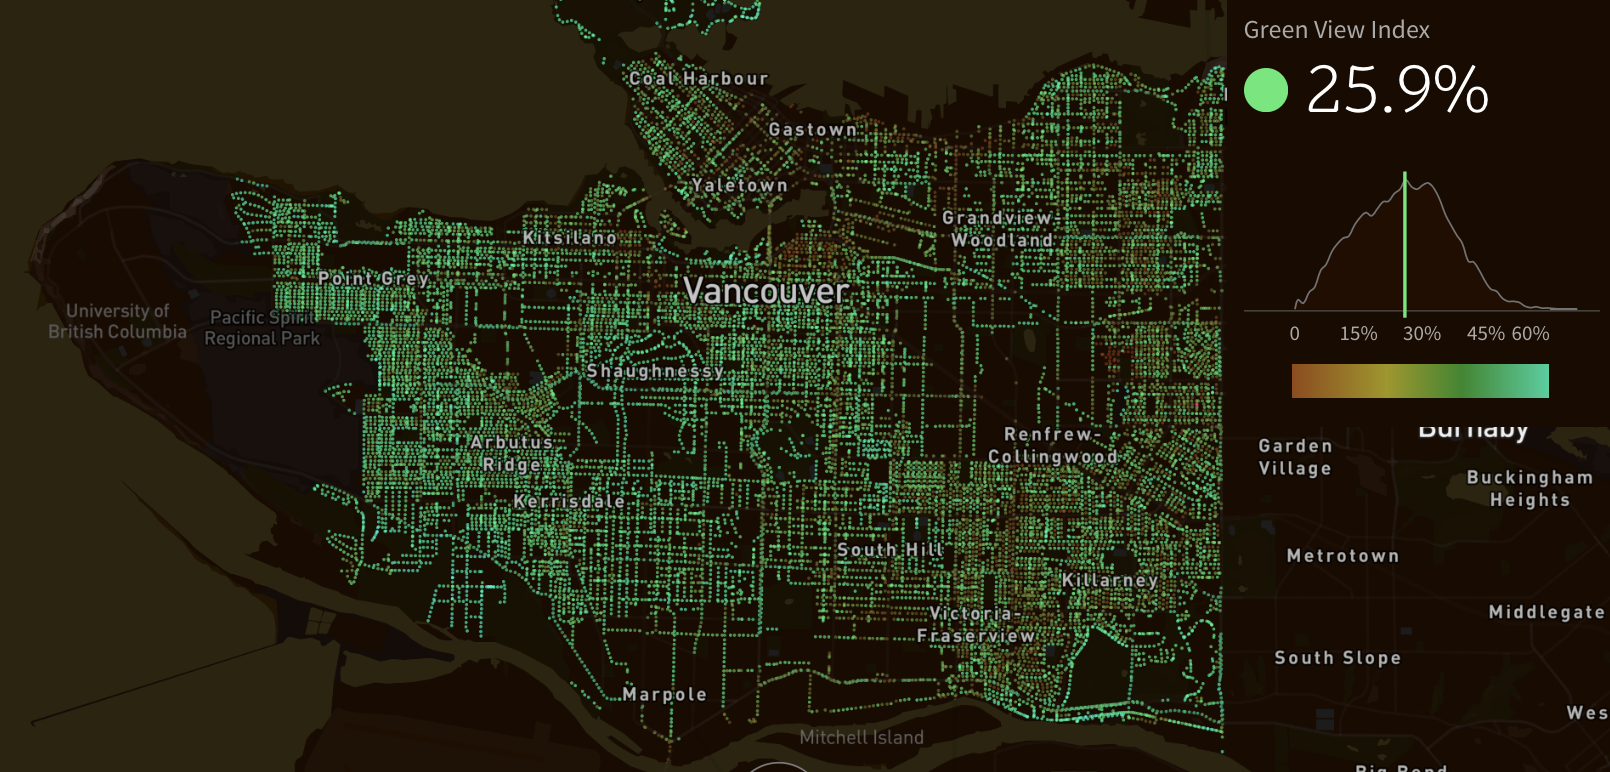
In order to do that researchers from MIT Senseable Labs partnered with the World Economic Forum to create Treepedia, a website with interactive maps that catalogues and compares the density of green areas in 13 major cities around the world.
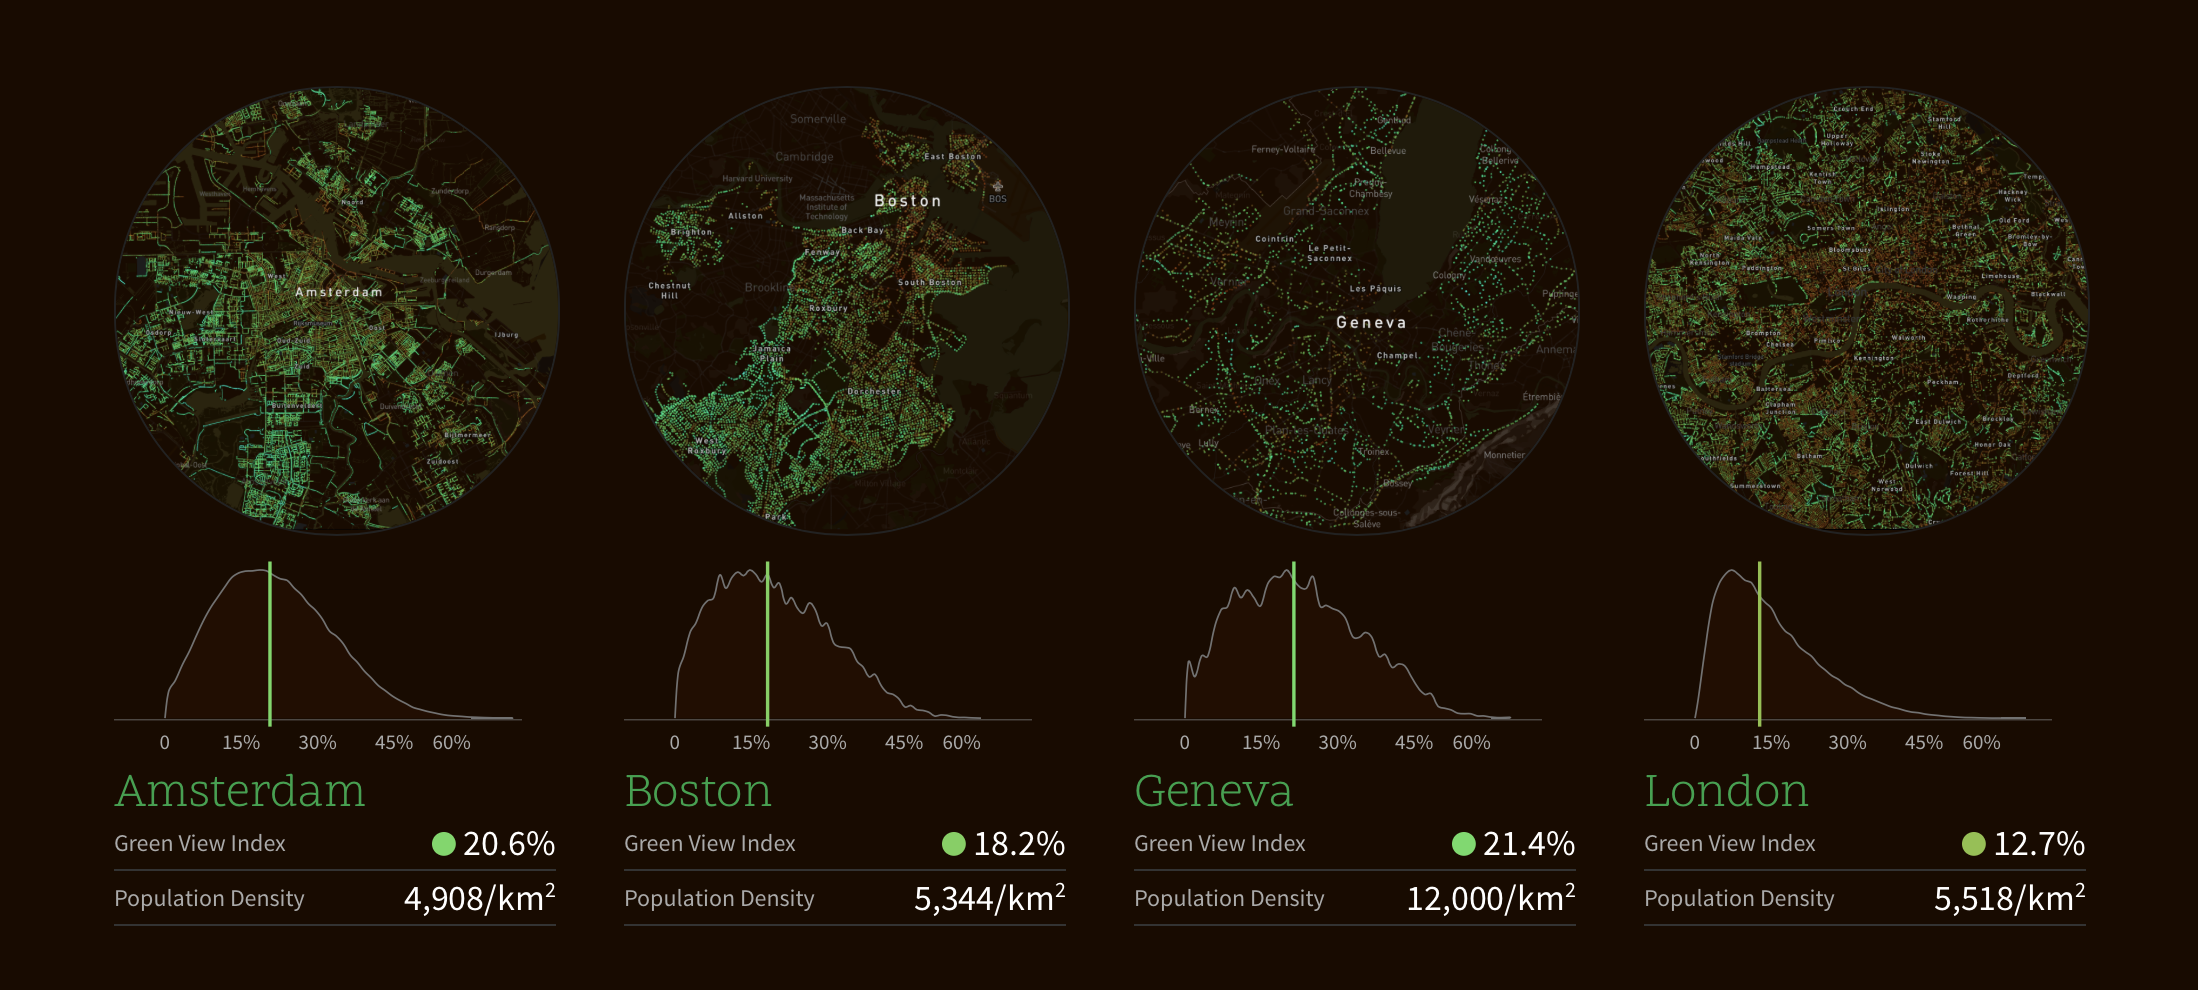
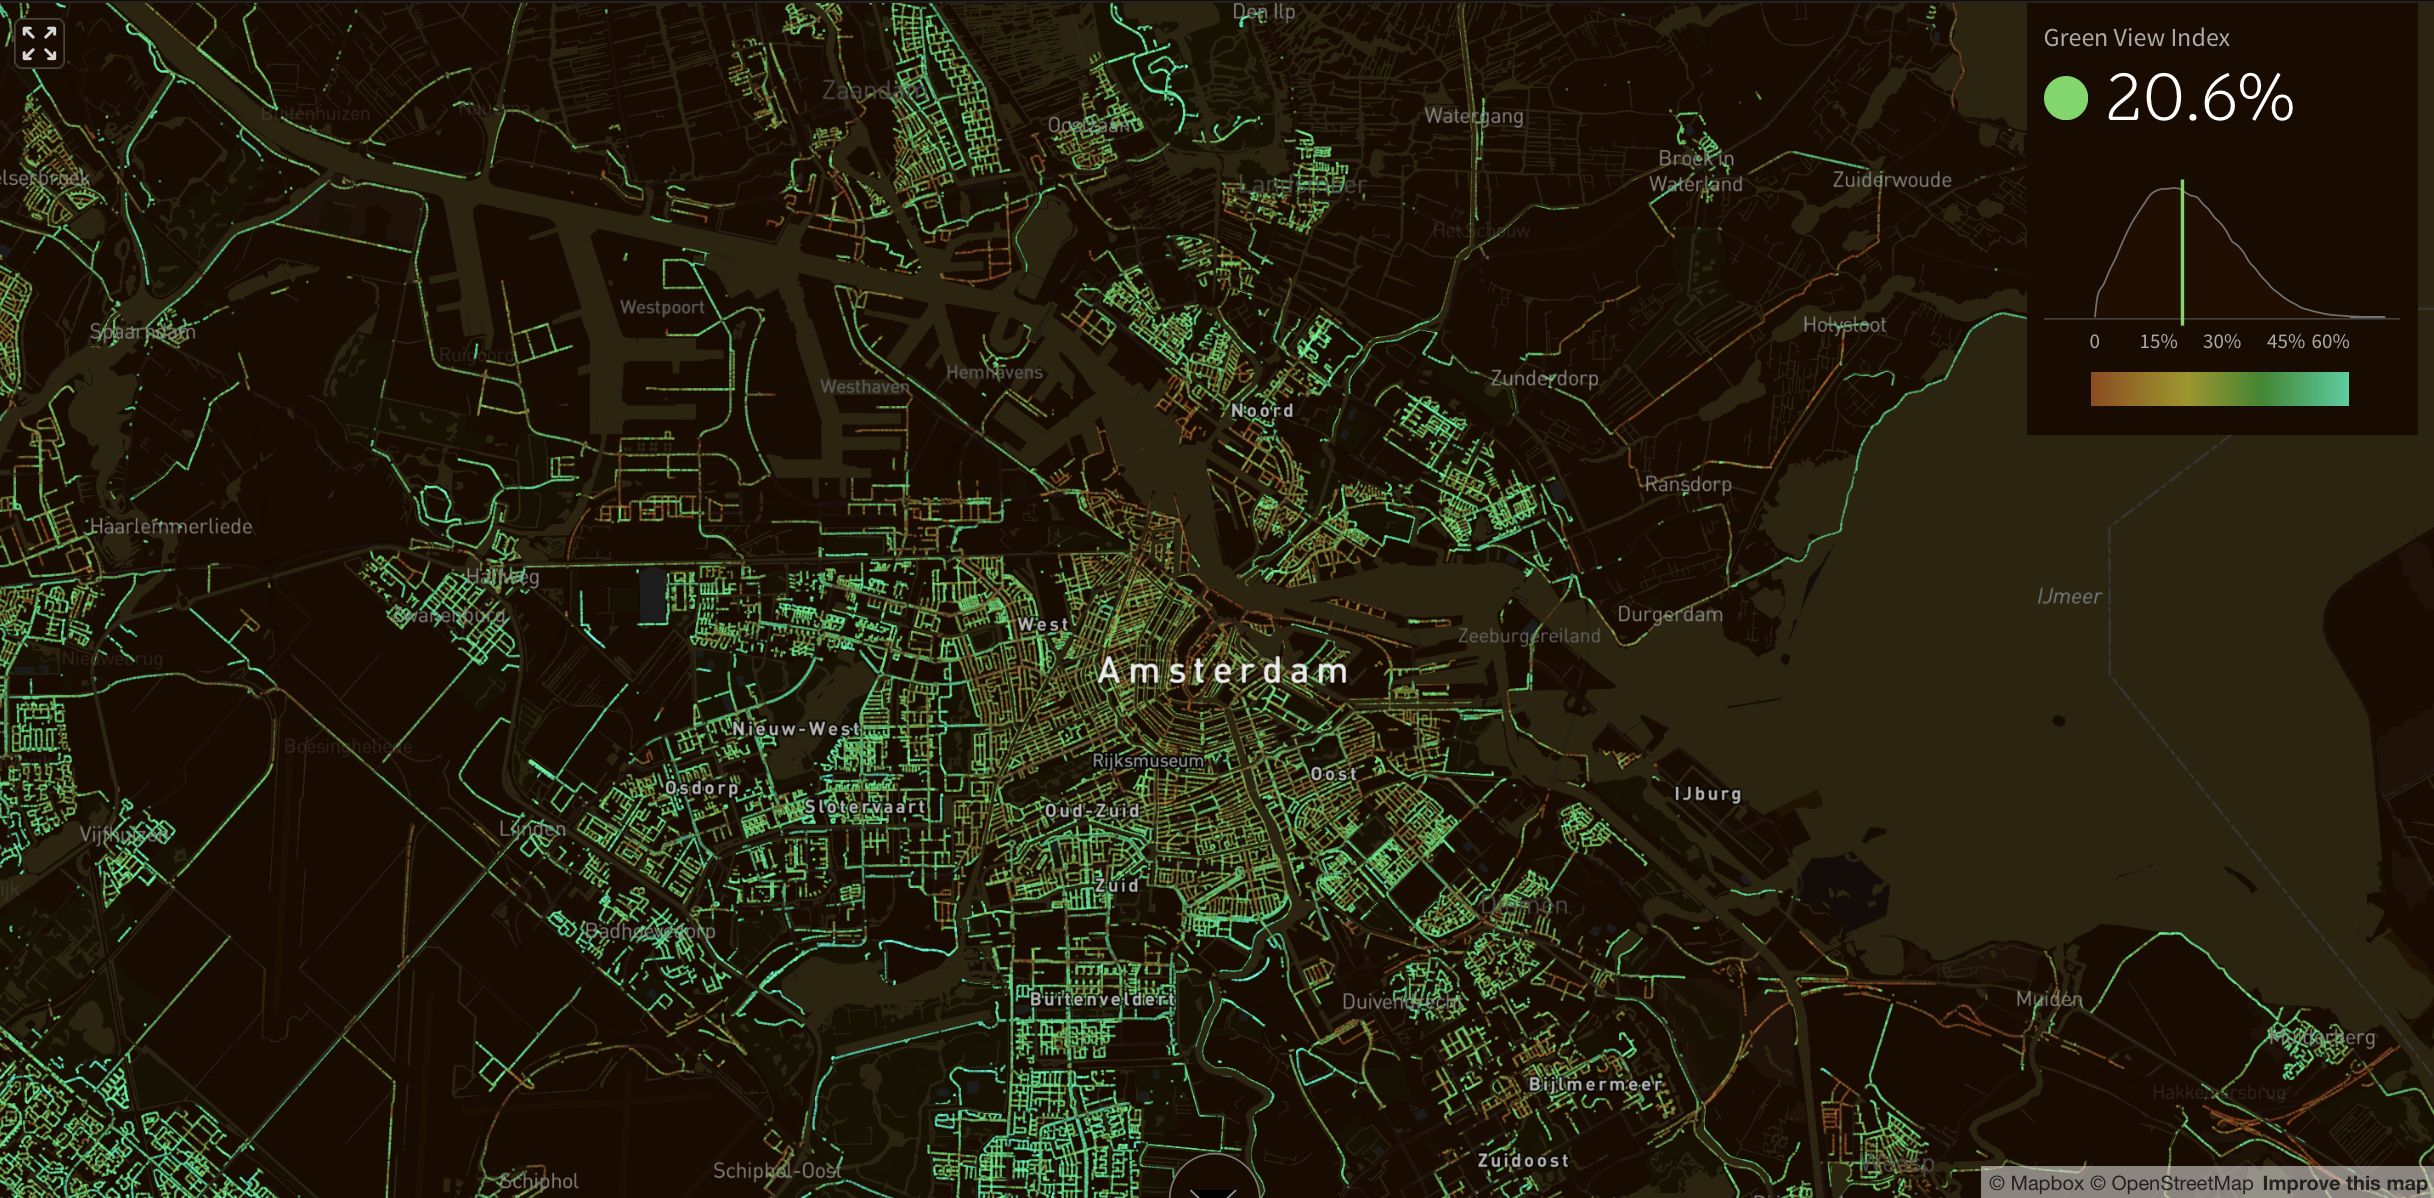
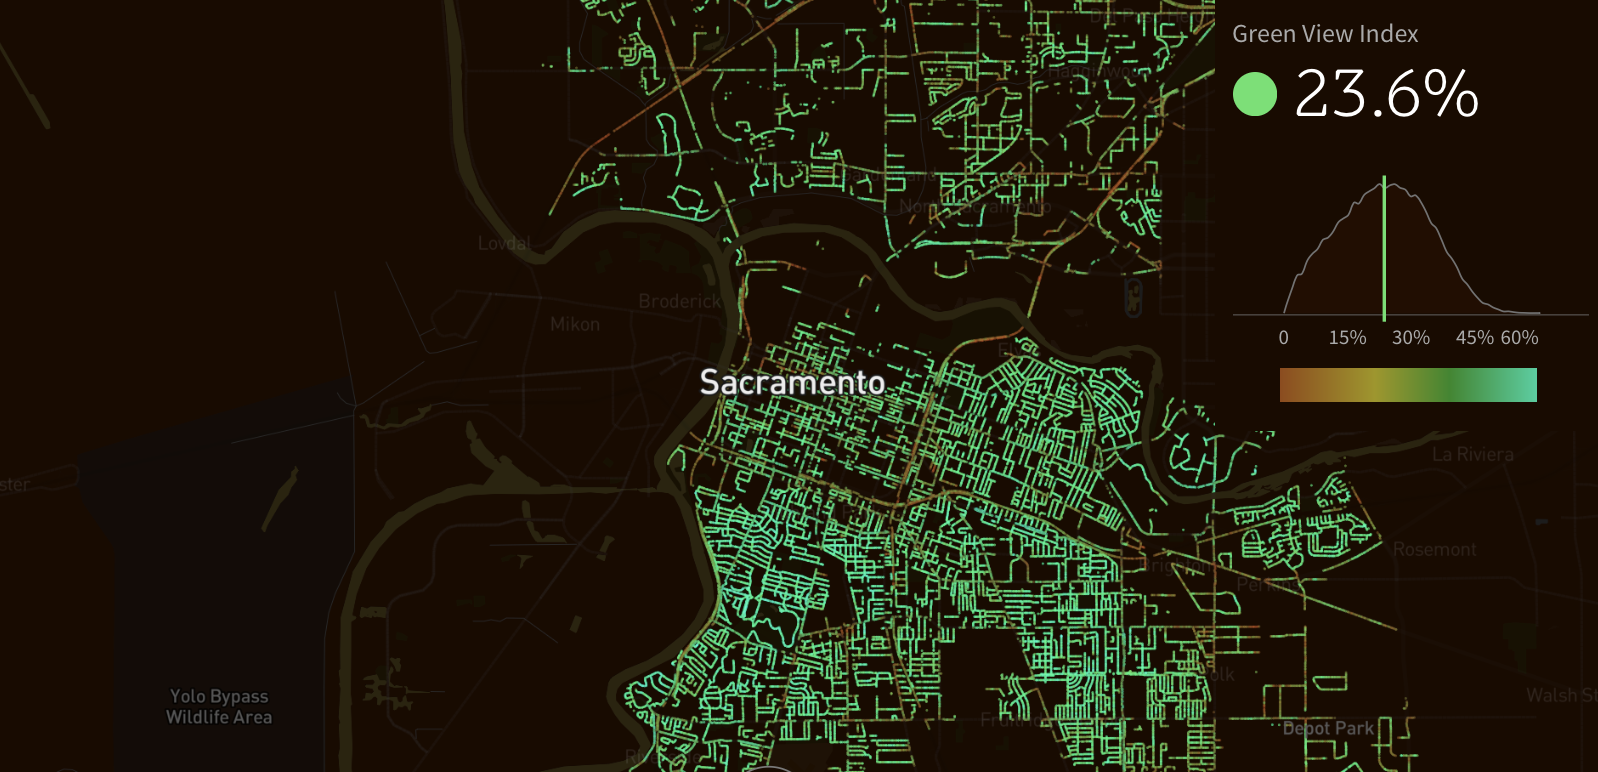
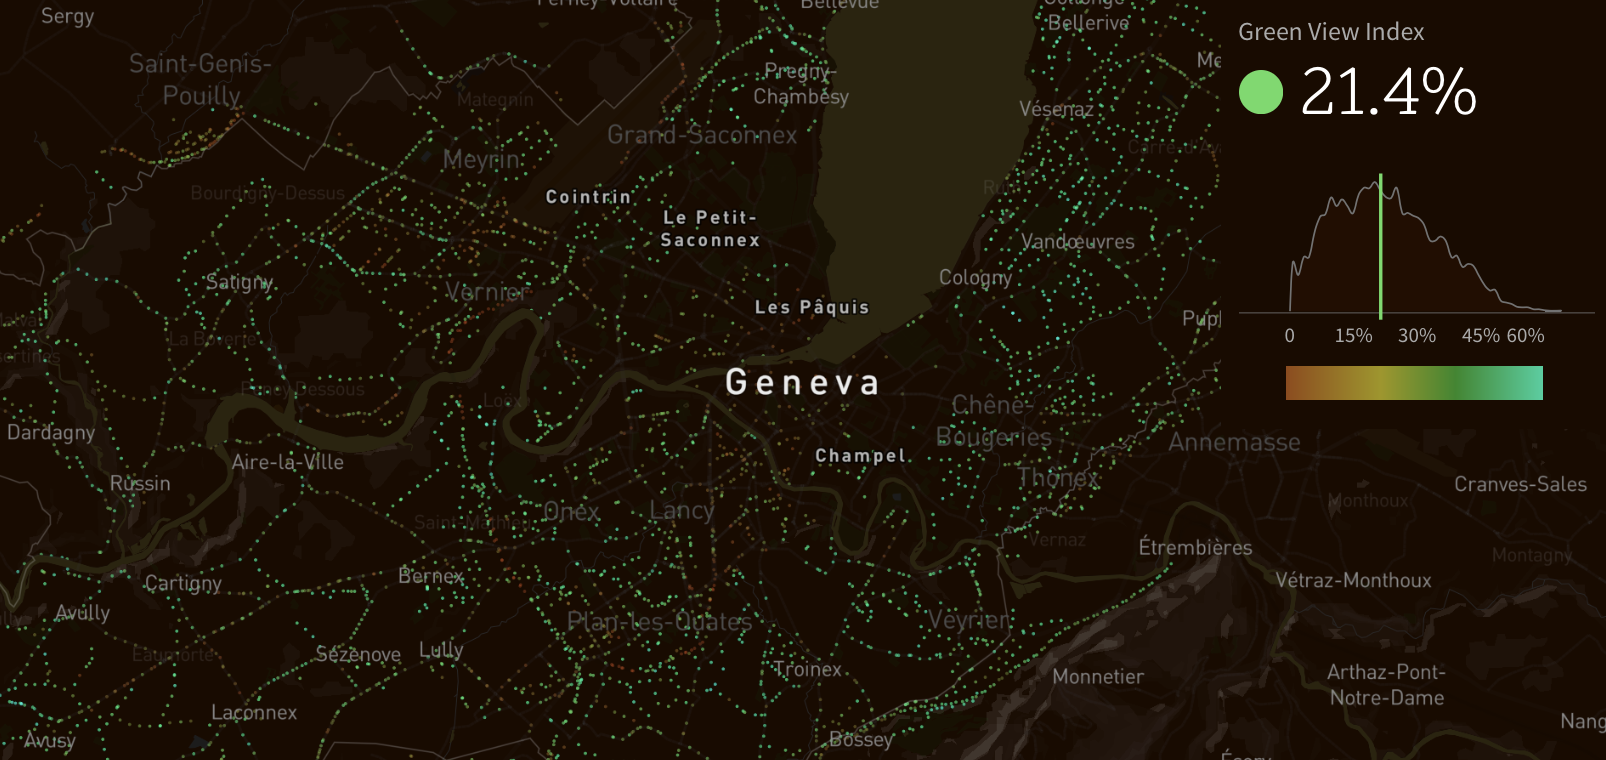
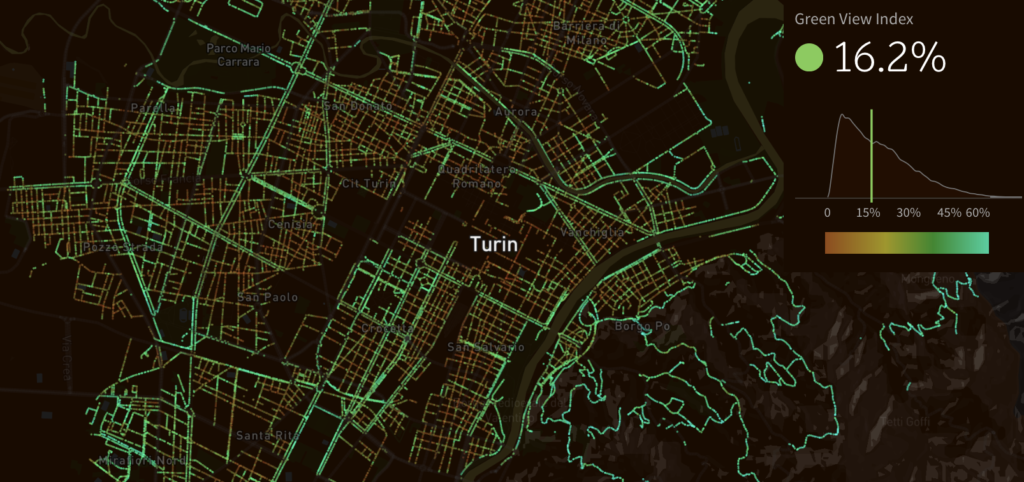
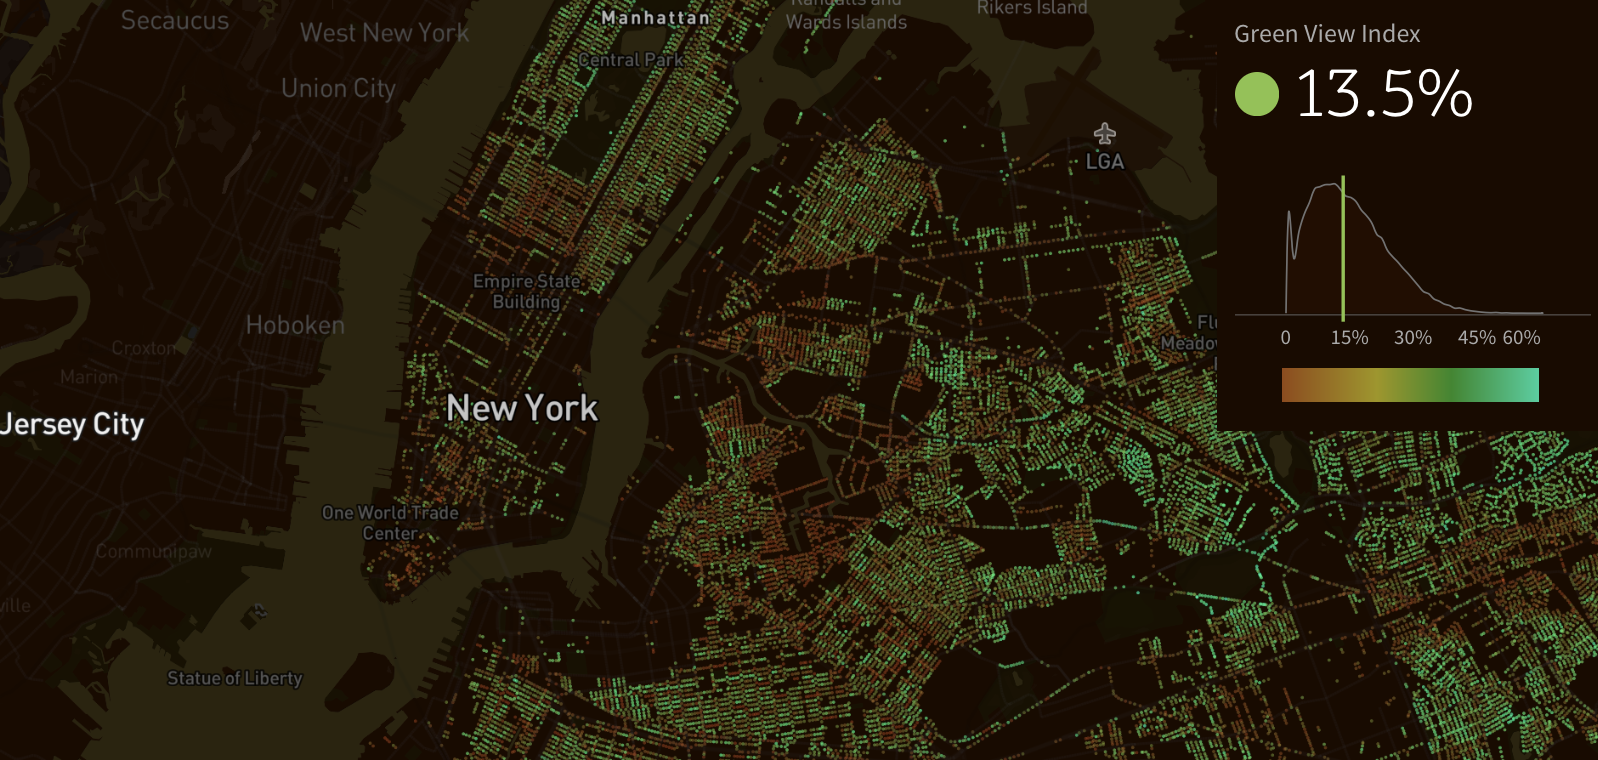
The data is based on the analysis of Google Street View panoramas. The researchers proposed a metric called the “Green View Index” that quantifies how many trees are there on every street. By using Street View rather than satellite imagery the index represent human perception of the environment from the street level. It can be used by cities to compare, evaluate and monitor the urban tree coverage and take actions to improve it.
The project has some obvious limitations. First of all the process of mapping the trees is not fully automated so the number of participating cities and therefore the impact of the project will be most likely limited. Secondly using Street View as a data source leaves out areas inaccessible to Google’s mapping cars (like private streets, parks and gardens, where most urban trees are concentrated).
In that sense the Green View Index is not directly reflecting the actual tree inventory of a city, but it’s a signal of how far a city has gone in greening its streets to their full capacity.
Here are profiles of the cities participating in the project:
Vancouver
Sacramento
Geneva
Seattle

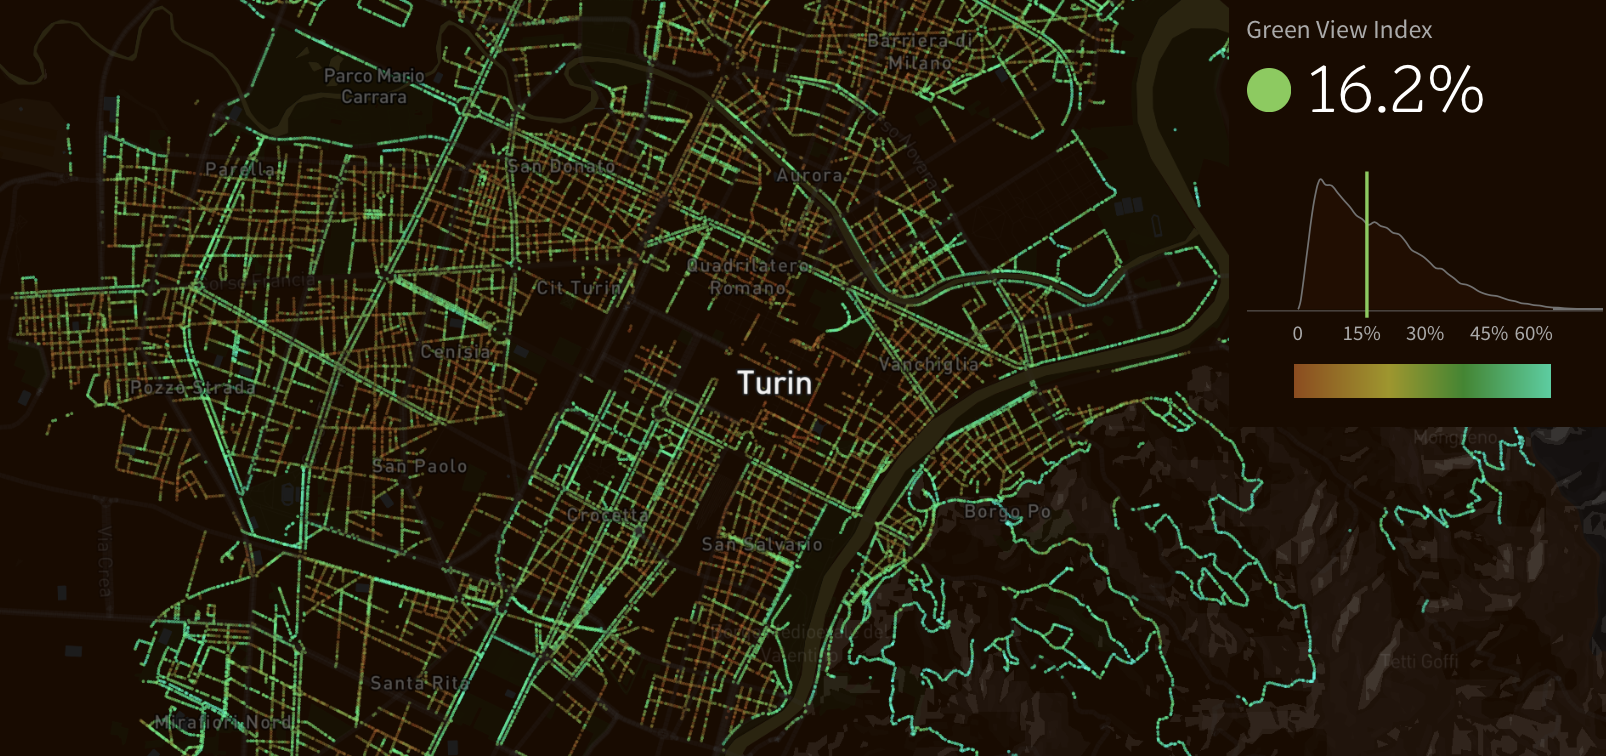
Turin
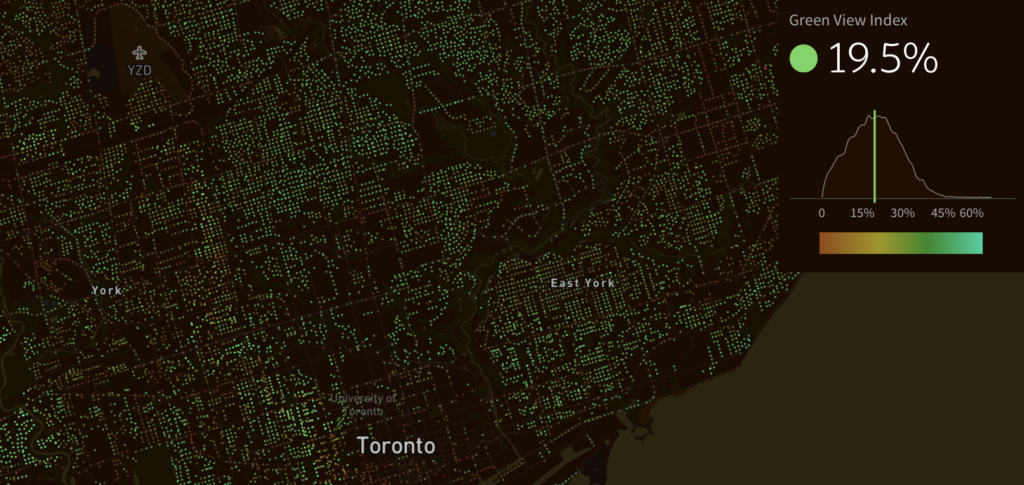
 Toronto
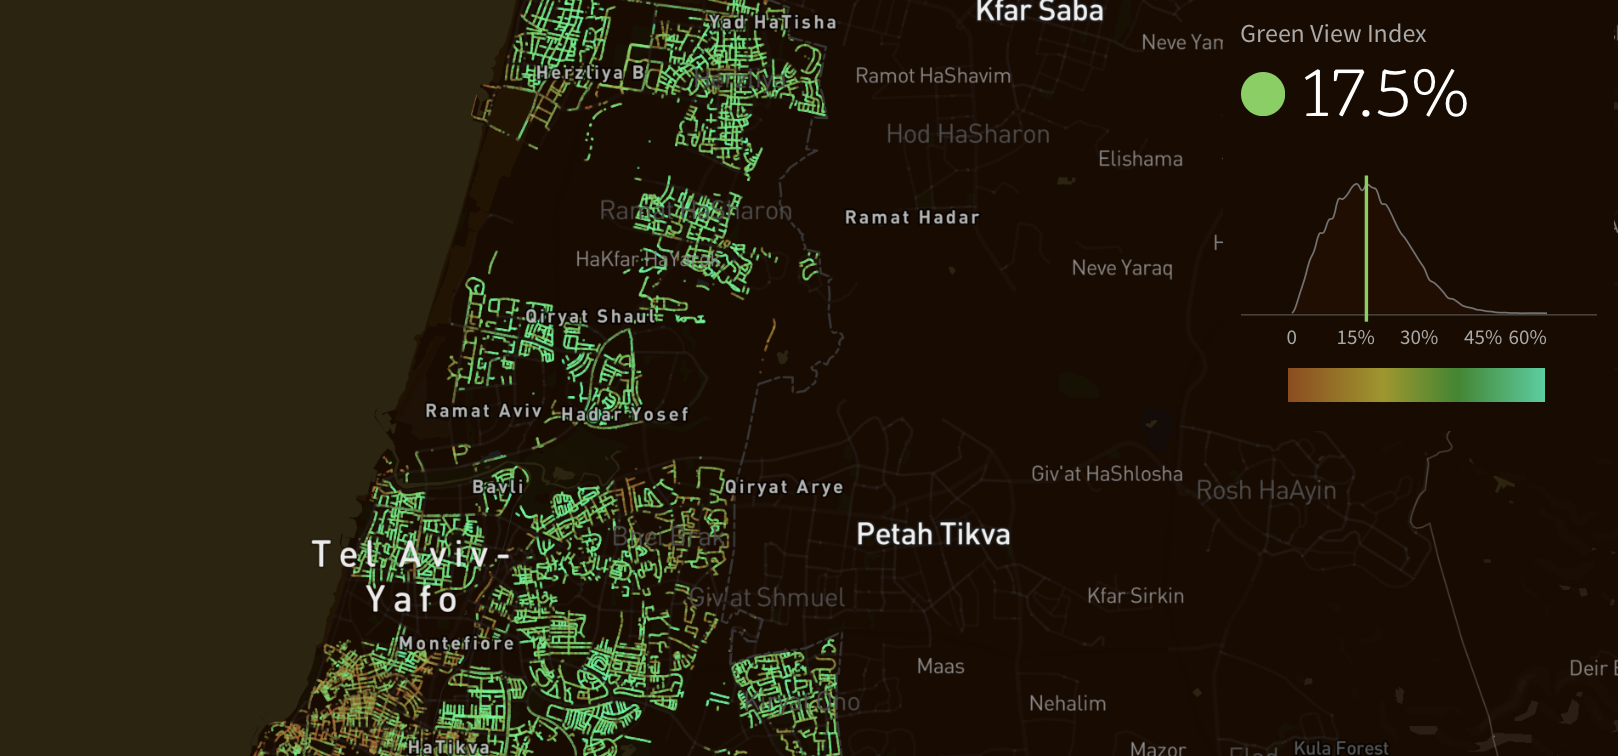
 Tel Aviv

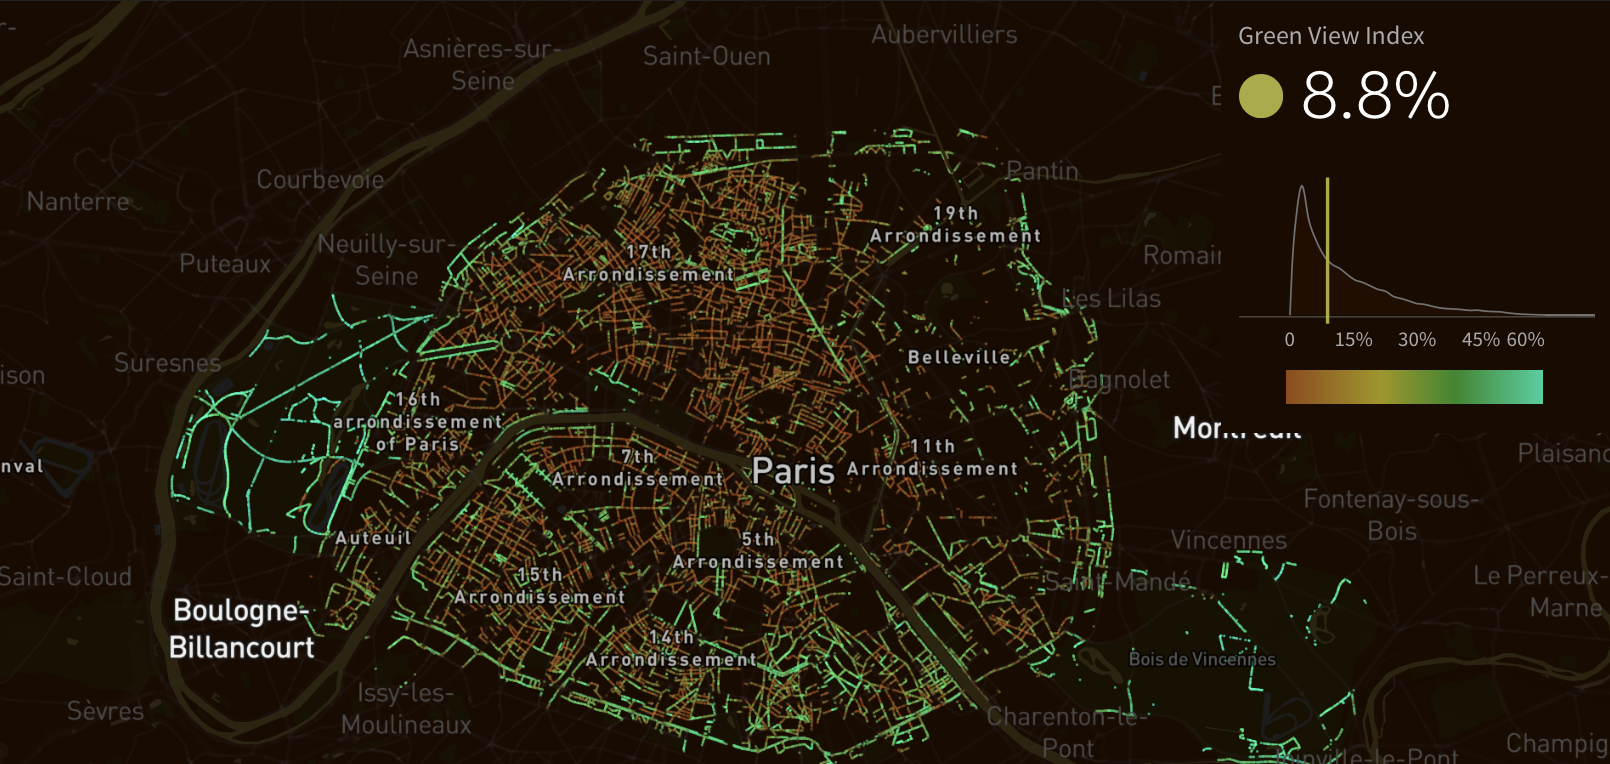
Paris
New York
Los Angeles
