Why don’t we start using a more accurate world map rather than the conventional Mercator map?

Why don’t we start using a more accurate world map rather than the conventional Mercator map?
No 2D map can accurately show the 3D Earth. A map that is accurate in one respect is necessarily inaccurate in a different respect. But that doesn’t mean all 2D maps are created equal.
What are the problems with Mercator?
1. Distorted sizes
The most obvious criticism is that it distorts the size of countries near the poles. The classic example is Greenland vs Africa. On a Mercator projection, they look about the same size.
In reality Africa is *way* bigger than Greenland.
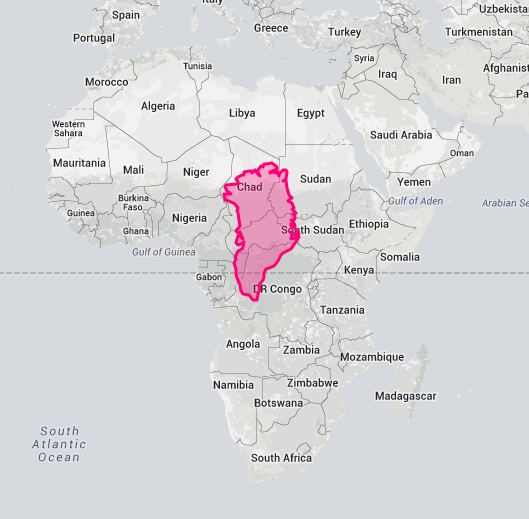
You can play around with the size distortions yourself on thetruesize.com.
2. Cultural bias
The distorted sizes are not only a problem because they give a mistaken idea of what the world looks like. Mercator also increases the size, and arguably the perceived importance, of white nations in comparison to non-white nations.
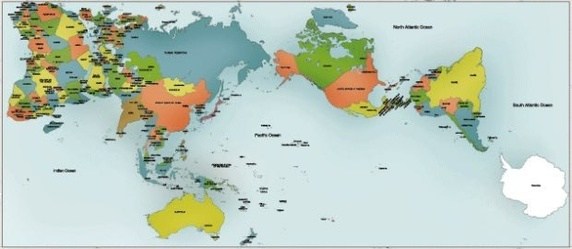
Mercator maps are also commonly cropped in an uneven way that adds even more prominence to Europe and North America. The map below is from the North Dakota Historical Society. The equator was drawn on by me to show how far off center it is.
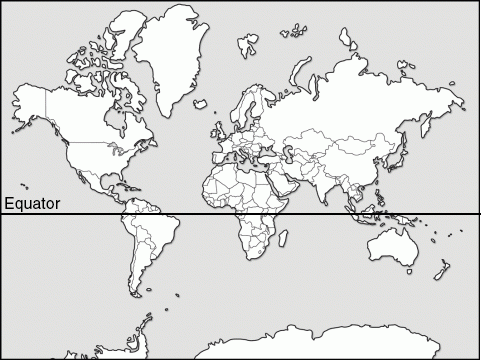
Some have gone so far as to call the Mercator projection “racist.” I disagree, but I don’t think it’s a stretch to say it is culturally biased.
3. Mercator is infinitely tall
Why is Mercator susceptible to being cropped as in the image above? Because it does not have a bottom or a top and always has to be cropped, leaving a lot of discretion to the person doing the cropping.
Here is what Mercator would look like if you were to crop its bottom further down.
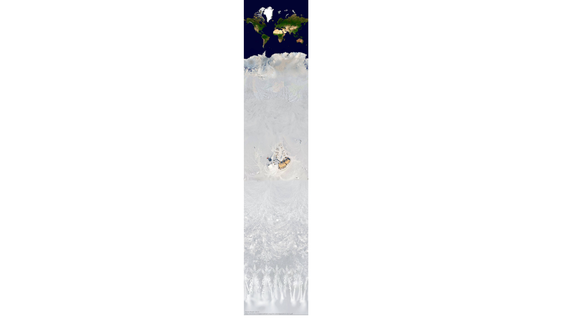
That structure in the center is Amundsen–Scott South Pole Station. And those shapes at the bottom are individual snow flakes. If you were to continue even further, you would eventually reach the scale of individual atoms, and beyond.
Mercator may seem “normal” since we are all accustomed to seeing it, but it is really a very strange way of mapping the world.
4. Mercator is NOT well suited for navigation
Defenders of Mercator often claim that it is well suited for navigation, since straight lines on the globe appear as straight lines on the map. That is actually a fallacy.
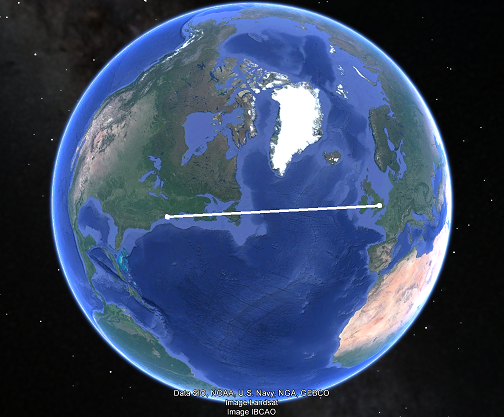
It’s true that lines of constant compass bearing appear straight on the map. But lines of constant compass bearing are in fact curved. To illustrate, imagine you wanted to fly from New York to London. Looking at a Mercator map, you would think it’s a straight route across the ocean.
In reality, a straight line from New York to London, the route that airplanes actually take, crosses over a large chunk of Canada. This is clear when you see it on a 3D globe.
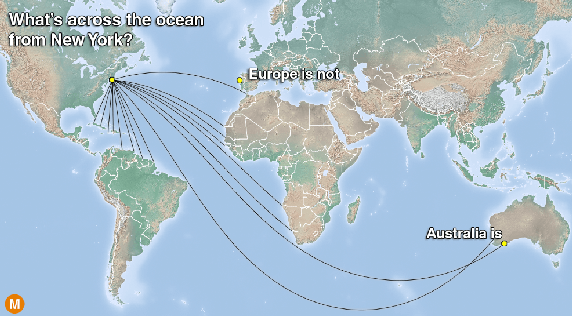
Although the lines in this next map appear curved, they are all actually straight on the globe. These are the routes that ships and planes actually take.
Why are we using Mercator in the first place?
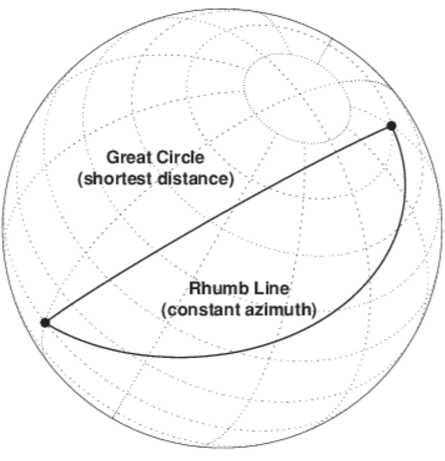
As mentioned above, lines of constant compass bearing appear as straight lines on a Mercator map. At one time, before the invention of GPS, ships did used to travel this way — keeping their bow pointed in the same direction with respect to their compass along the entire route. In those times, Mercator really did serve a practical purpose.
These lines of constant compass bearing are known as rhumb lines. And though it may seem counter-intuitive, following the same direction on your compass actually takes you along a curved path.
What map should we be using?
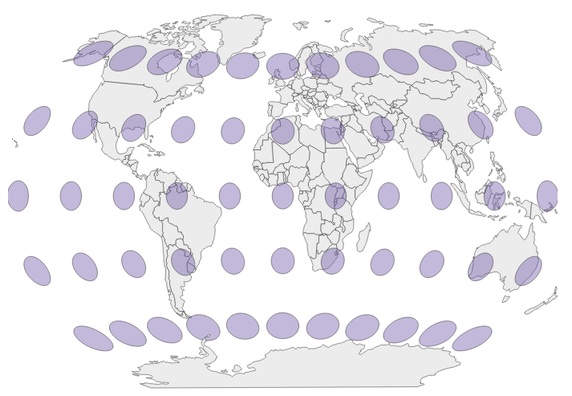
1. Gall-Peters?
The original question points out the Gall-Peters projection as an example of a “good” 2D map. It is essentially a Mercator map that has been adjusted to remove the size distortions. But that causes other problems. Namely, the shapes of countries are all wrong.
Look at the shape of Greenland. It looks short and fat. In realty, the true shape of Greenland is tall and skinny, closer to how it looks in Mercator.
2. Miller?
The Miller projection is a compromise between Mercator and Gall-Peters. It retains most of Mercator’s shape, but removes some of the extreme size distortion. Here is how the three map projections compare side-by-side.
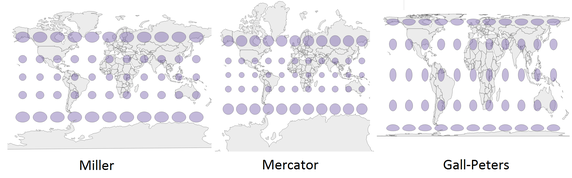
The Miller projection is the one I use most frequently, since it is one that people find familiar looking and easy to understand. But from an objective perspective, there are other possibilities I prefer.
3. Winkel-Tripel?
In addition to sizes and shapes, there are a few other ways that map projections can distort the globe. If you want to know more about how to measure a map’s accuracy, you can find a good writeup about it here. But when you take them all into account, one map projection that stands out as having a great balance is the Winkel Tripel projection.
The sizes are only slightly distorted, as are the shapes. Straight lines on the globe appear curved, but only slightly.
Winkel-Tripel also happens to be the map projection used by National Geographic. And I think there is a strong case that this is the one we should be using in classrooms.
4. Authagraph
I’ve saved the best for last.
The Authagraph was invented only a few years ago, in Japan. And already it is starting to take hold over there as the map projection of choice.
It challenges our view of what the world looks like, but it is highly accurate in all respects, so much so that it can be folded up to form a 3D globe.
Unlike the Winkel-Tripel, the Authagraph is rectangular, which makes it easier to work with from a cartographic perspective, and also better suited to presentation.
And it’s great looking.
My prediction: within our lifetimes, you will see the Authagraph hanging on classroom walls.


#Ideas


Next article

As a GIS analyst, you can raise your market value by learning to program. This is easier said than done: the possibilities can be overwhelming, especially if you don´t know where to begin. That´s why I put together this guide to get you started with Python programming for GIS.
GIS programming in my opinion starts with Python, but certainly won´t end there. From a beginner’s perspective, it´s not recommended to start learning as many languages right away, but instead to start easy and differentiate later on, depending on your needs. Python is a good choice to start for learning GIS programming, as it can be used as a scripting and programming language. In ArcGIS, Python scripting can be used for automating tasks (through running Python scripts), as well as writing applications, such as add-ins. This guide focuses on Python scripting as Python programming is more complex and takes more time to learn – for now, we´re good with learning Python scripting.
One: First things first – learning the basics
So, to begin with, I’d recommend learning the basics of Python –I´ll get to the GIS part later. In order to be able to use Python within a GIS, you need to learn about Python syntax, data types, commands, built-in functionalities, loops and the like. If you´re new to programming, this can be a little overwhelming at first as Python has a lot of built-in functionalities. It´s not necessary to know the language from a to z to use it within a GIS – with some basic knowledge you can get up to speed pretty fast and use it within ArcGIS. I also recommend learning how to request help files within the interpreter and list available methods, functionality and modules, rather than consulting the external help files. This gives you more control of the language itself.
For the Python beginner, there are a lot of free Python beginner tutorials available online and almost all of them cover the same basic topics: strings, functions, data types, syntax – all essential topics that will be used anywhere when working with Python – skip theory about object-oriented programming, as you don’t need to know that for Python scripting (however, you WILL need it when you decide to create Python add-ins in ArcGIS).
At this point, you might need a local version of Python installed on your computer (from www.python.org), or opt for an online IDE, such as Python Fiddle that lets you write and run Python through a web browser. Whether option you choose, you will notice there are different Python versions available – GIS users are recommended to learn Python 3, as this is the wave of the future. However, that doesn’t mean that Python 2 has no value, quite the contrary: ArcGIS Desktop for example uses Python 2 and is likely to keep doing that. To get an idea of the differences between both versions, do a Google search for “Python 2 vs 3” or “Key differences between Python 2 and 3” and read some documentation on the topic.
If you have ArcGIS Desktop installed on your computer, it comes with Python automatically installed so you don´t have to make the choice for a version. Just click at the ArcGIS sub-menu in the Windows task bar, click the IDLE (Python GUI) . A Python terminal opens with a command line (“>>>”) where you can start writing code right away. Execute the code by hitting enter and see the direct results printed at the screen.
Two: Mastering the basics through practice
We’re still learning the basics – and learning Python or any programming language means a lot of practice. Practice with online exercises from Code Academy or the free “Try Python” course from Code School. Once you’re familiar with the basics, it´s time to do some research on how Python scripting works and the differences between writing and running scripts and using an interactive Python interpreter. As this is not covered in many online courses, this may require some online searching but for GIS analysts this is essential knowledge. You also might want to practice with writing and running a few of your own scripts – no matter how simple they are. Also learn how to comment your code – no matter how simple the code is, you’ll be thankful later you did this when you first wrote it.
It is recommended to use an IDE (Integrated Development Environment) for writing and running Python scripts. This is nothing more than a piece of software that functions as a code-editor, enabling you to write, run, debug and save code. You can download and install a (free) IDE – such as PythonWin – on your computer and write, run and debug your scripts from there. IDE’s are a preferred place to write code as they help you by coloring your code as to separate different elements, making it easier to notice errors before and after running a script.
While we’re at it, you might want to check out some of the built-in functionality of Python, such as the math module that is part of the standard library that comes with a Python installation. Working with numbers is again an essential part of GIS and Python, and that math knowledge from college might need some refreshing. As Python allows you to work with geometries from objects in a GIS, knowing what´s available with this library might come in handy latter. The Python documentation (available both online and locally, as it comes with an installation) can be consulted to see what´s available. Other skills that will in handy later are learning to write data to a new file with Python, setting source data paths correctly, how to write SQL statements correctly in Python, use “try and except” blocks and learn about error messages.
Three: Using Python in ArcGIS
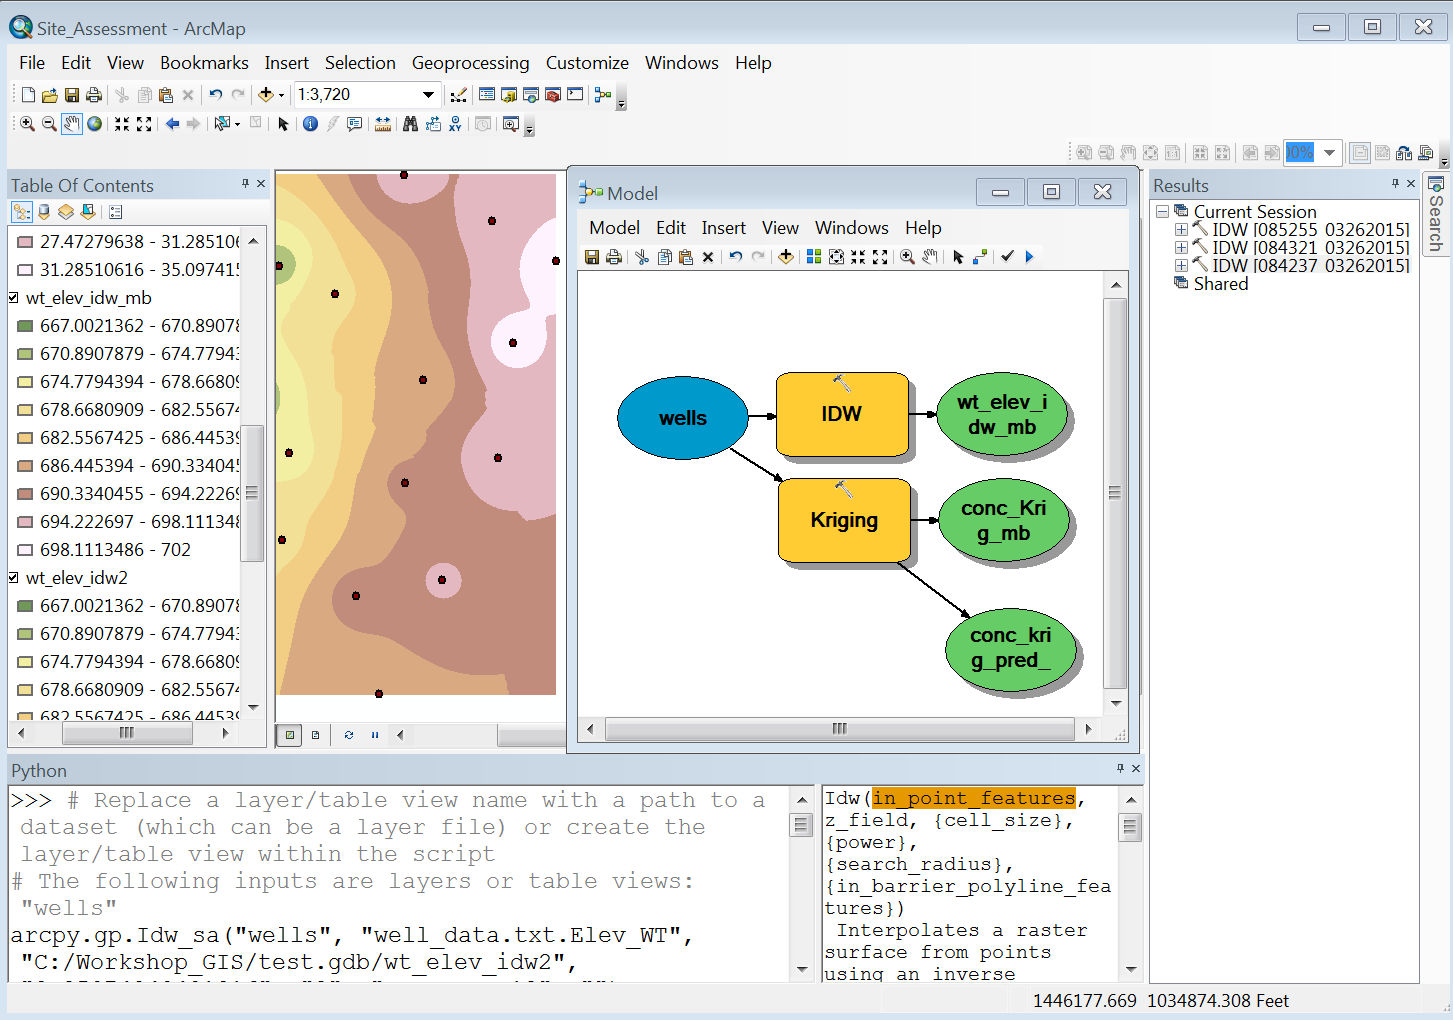
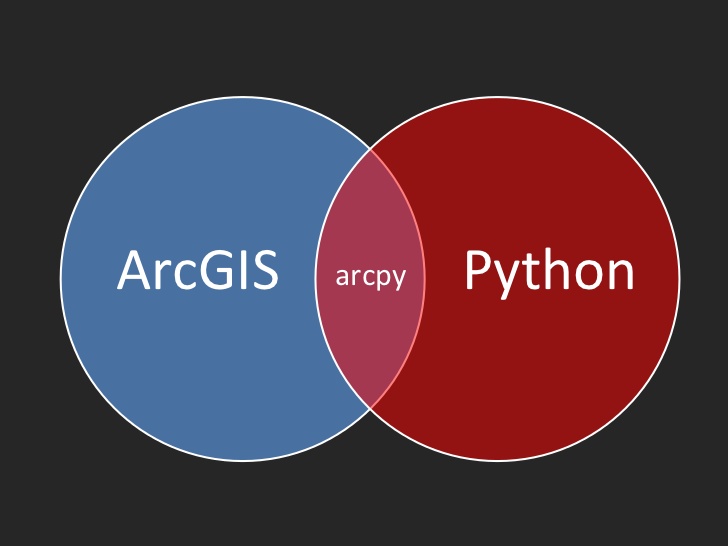
With some Python practice under your belt, you might want to move on and use it in ArcGIS. ArcGIS users (both ArcMap and ArcGIS Pro) might start using the Python window that is a great way to start learning the ArcPy site package. This is a collection of modules that allow access to all geoprocessing functions and more. Notice that ArcGIS Pro uses Python 3 while ArcMap uses version 2. The Python window has a great interactive help window that helps you writing code, by specifying the parameters for a tool, as well as autocompletion of code, saving you a lot of time. This is a great way for learning ArcPy and should be your first start. Once you´re confident using ArcPy, try writing some standalone scripts using local GIS data, run them and see what happens.
Common sense is your best friend here: it’s common to have filenames and -paths spelled wrong, which may cause errors. Even though a Python script has been checked correctly by the IDE for mistakes, it may contain errors, such as misspelled filenames, paths, commands and tools. Wrong use of capitals is also a common error and Python is very sensitive to this. You can control the process of your script by letting it print out messages to see how things are progressing, such as “print(“new geodatabase created correctly”). If a script terminates without errors, open ArcMap and visualize the results your script created. If the output is not as expected, there may be something wrong with your code.
To become acquainted with ArcPy and Python scripting in general, there are many online tutorials and books available that explain in detail how everything works. Again, start with the basics and then move on to more complex topics. The ArcGIS Help section is essential reading for learning ArcPy, but you might be served with extensively annotated example scripts and exercise books with example data to experiment with, created by experts.
Although a niche market, there are many helpful books available about GIS and Python scripting. What´s good to know is that many of these books are written for intermediate and advanced users, so make sure you know your basic Python skills and get to know ArcPy well before starting with these. A good introduction to the ArcPy site package is Paul Zandbergen´s book “Python Scripting for ArcGIS” – although it´s more a reference book than a hands-on book. Be sure to combine it with a hands-on book, such as “A Python Primer for ArcGIS”, the first book on Python scripting for ArcGIS, written by Nathan Jennings. It focuses on python scripting and has a lot of well-annotated scripts and step-by-step tutorials that I enjoyed a lot: even though it´s a little dated, all the scripts run just fine with later versions of ArcGIS. I´d rate this as an Python book for the intermediate Python student. In addition, David Allen´s “GIS Tutorial for Python scripting” offers the most comprehensive overview of what´s possible with Python in ArcGIS. To get the most value out of this book, ask for an answer sheet from Esri Press as the editing of the book is problematic at times and the example code contains errors (the instructor code on disk works fine though).
Four: Python scripting and beyond
With some Python experience, you might be interested in knowing where to go next. Before delving into other languages and/or frameworks, look for techniques to improve your current Python code, for example by refactoring it by using list comprehensions where possible. Look for new geospatial modules that make your coding work easier. Compare the work from professionals with each other and use good coding habits from others to improve your work.
The learning path described above is time-consuming as well as iterative – you´ll find yourself going back and forth between different stages and learn something new every day. But it is also fun and full of surprises. The more you learn and practice, the easier it becomes. The good thing is that Python extends GIS – think of many other geospatial libraries or using the language “R” with Python.
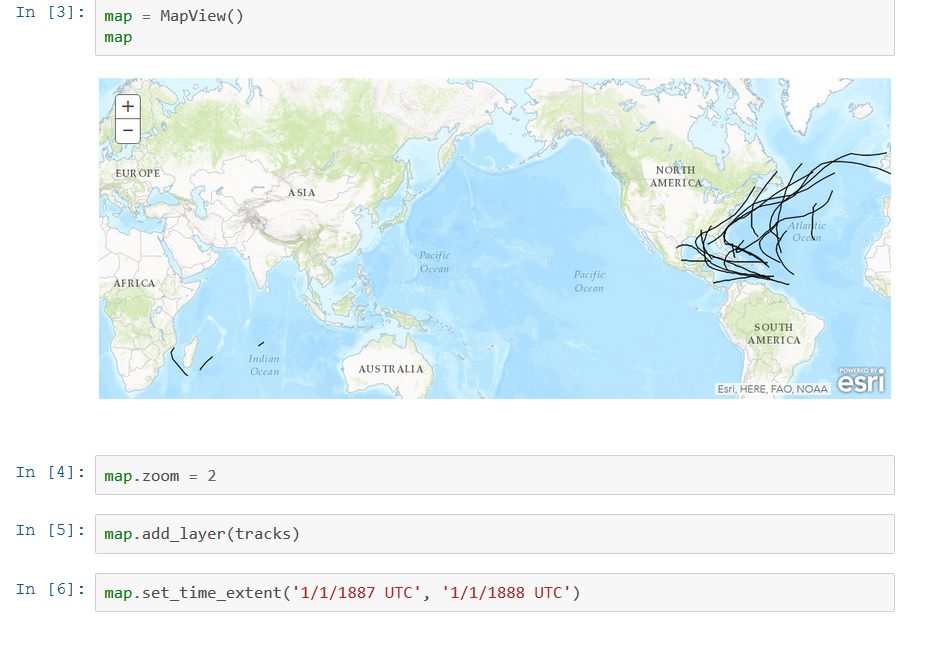
After learning Python and Python scripting and programming with ArcGIS, there are many options for continuing your GIS programming journey. A few options are listed here. Take for example the ArcGIS Python API that has been released this year by Esri. This API enables use of Python and maps over the web, extending its use outside of desktop GIS. The ArcGIS JavaScript API is another example of a programming language (JavaScript in this case) that allows for interacting with maps through a browser. As web technology is everywhere, it is a logical next step after learning Python – start with HTML CSS, and then move along to JavaScript. After becoming familiar with the basics, you´ll find out that JavaScript also offers many libraries and frameworks that allow for mapping that are worth learning.